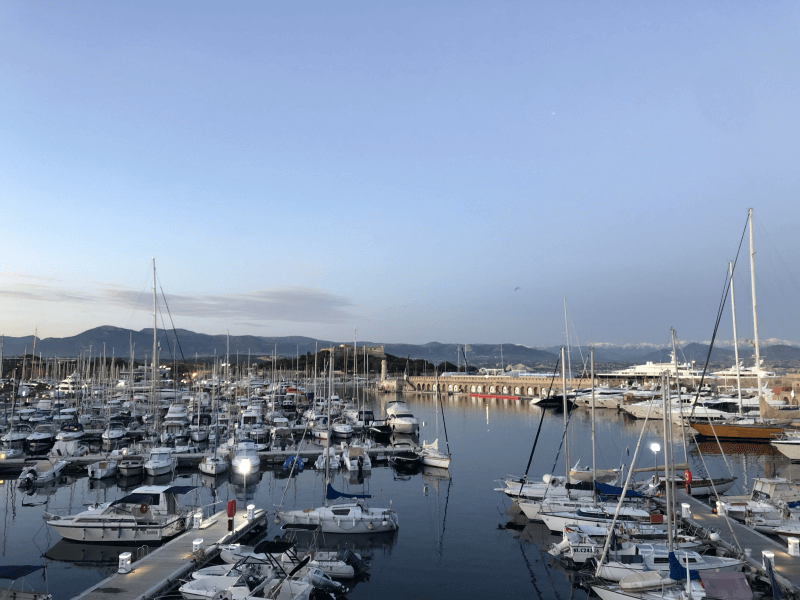
Port Vauban
Auteur : Gleb
Signaler

Port Vauban
Auteur : Gleb
Signaler
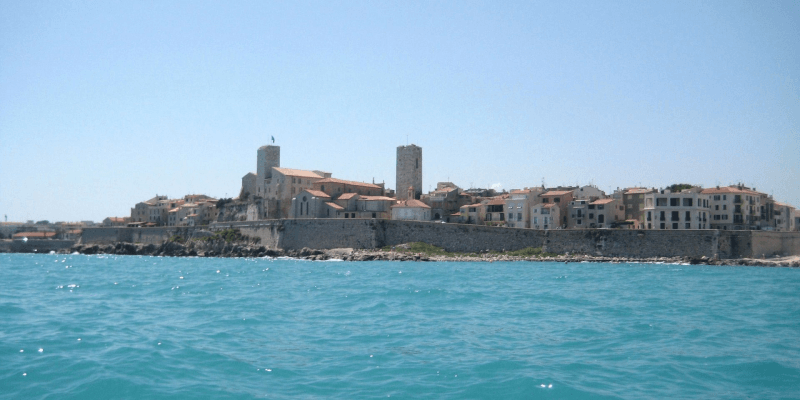
Vieil Antibes
Auteur : Aimelaime
Signaler
Quel est le profil de la population, sa situation démographique ?
| Nombre d'habitants | 76 612 | Classement |
| Age moyen | 46 ans | Classement |
| Pop active | 44.4% | Classement |
| Taux chômage | 9.3% | Classement |
| Pop densité | 2 947 h/km² | Classement |
| Revenu moyen | 24 410 €/an | Classement |
Quels sont les résultats des dernières élections aux présidentiels 2022 ?
 Emmanuel MACRON
 Marine LE PEN
 Jean-Luc MÉLENCHON
 Éric ZEMMOUR
 Valérie PÉCRESSE
 Yannick JADOT
 Nicolas DUPONT-AIGNAN
 Jean LASSALLE
 Fabien ROUSSEL
 Anne HIDALGO
 Philippe POUTOU
 Nathalie ARTHAUDEmmanuel MACRONMarine LE PEN
| Agressions physiques / sexuelles | 1 285 |
| Cambriolages | 267 |
| Vols / dégradations | 2 993 |
| Stupéfiants | 297 |
Commerce |
|
|---|---|
| Hypermarché | 1 |
| Supermarché | 16 |
| Boulangerie | 68 |
| Boucherie | 48 |
| Station-service | 13 |
| Banque | 41 |
| La poste | 5 |
| Coiffeur | 165 |
| Vétérinaire | 24 |
| Restaurant | 636 |
Santé |
|
|---|---|
| Médecin | 600 |
| Dentiste | 116 |
| Pharmacie | 39 |
Éducation |
|
|---|---|
| Maternelle | 21 |
| Primaire | 21 |
| Collège | 8 |
| Lycée | 5 |
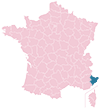
Carte de la ville de Antibes

Achat / Vente / Location Votre agence immobilière à Antibes

Les actes d'incivilités envahissent nos rues, agissons ! Un follow instagram = Un soutien
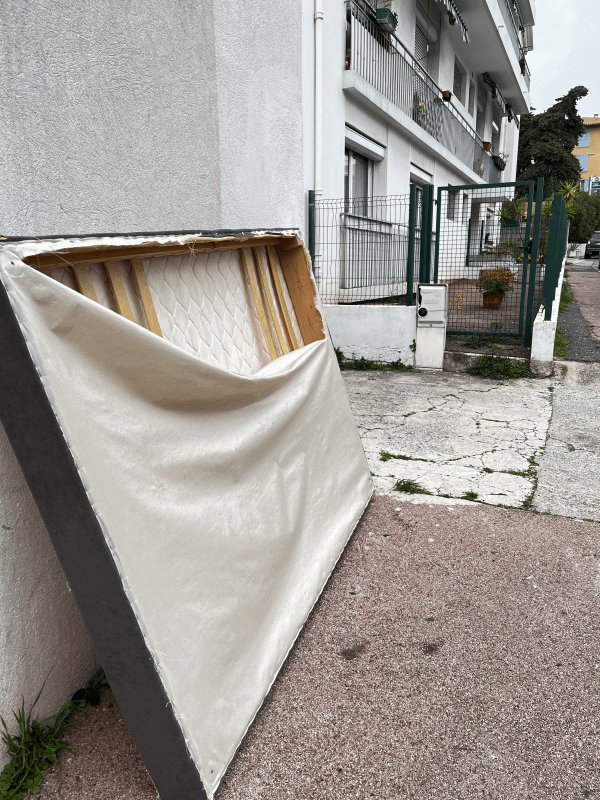
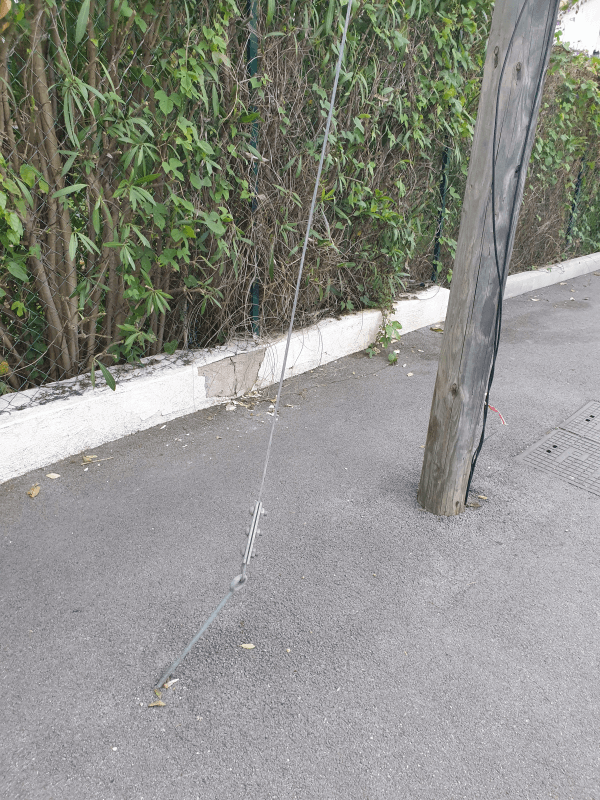
NOUVEAU : Décharges sauvages, détritus, objets abandonnés, graffitis, nids-de-poule : Déclarer un incident à Antibes
| Ville | Habitants | Superficie | Pop densité | Pop active | Taux chômage | Revenu moyen | Prix immobilier | Note globale |
|---|---|---|---|---|---|---|---|---|
| Statistiques Vallauris | 28 579 | 13 km² | 2 198 h/km² | 40.9% | 6.2% | 22 180 €/an | 4 126 €/m² | 2.9 |
| Statistiques Biot | 10 196 | 15 km² | 680 h/km² | 46.8% | 3% | 30 320 €/an | 5 081 €/m² | 3.8 |
| Statistiques Villeneuve-Loubet | 16 729 | 19 km² | 880 h/km² | 48.6% | 5.1% | 26 260 €/an | 5 175 €/m² | 3.6 |
| Statistiques Le Cannet | 40 198 | 7 km² | 5 743 h/km² | 46% | 5.9% | 22 250 €/an | 3 445 €/m² | 3.7 |
| Statistiques Cannes | 74 040 | 19 km² | 3 897 h/km² | 40.6% | 6.5% | 21 210 €/an | 4 874 €/m² | 3.3 |
| Statistiques Mougins | 19 481 | 25 km² | 779 h/km² | 48.9% | 4.8% | 27 390 €/an | 4 785 €/m² | 3.6 |
| Statistiques Cagnes-sur-Mer | 52 852 | 18 km² | 2 936 h/km² | 45.5% | 5.1% | 23 940 €/an | 4 196 €/m² | 3.3 |
| Statistiques Roquefort-les-Pins | 7 284 | 21 km² | 347 h/km² | 45.9% | 3.1% | 34 070 €/an | 4 702 €/m² | 3.4 |
| Statistiques Saint-Laurent-du-Var | 31 645 | 10 km² | 3 165 h/km² | 47.4% | 4.7% | 24 360 €/an | 4 170 €/m² | 3.1 |
| Statistiques Valbonne | 12 389 | 19 km² | 652 h/km² | 50.4% | 4.8% | 29 220 €/an | 4 473 €/m² | 4.3 |
| Statistiques La Colle-sur-Loup | 8 143 | 9 km² | 905 h/km² | 45.8% | 2.9% | 29 030 €/an | 4 755 €/m² | 4.3 |
| Statistiques Mouans-Sartoux | 10 847 | 13 km² | 834 h/km² | 43.3% | 3.6% | 27 840 €/an | 4 272 €/m² | 3.4 |
| Statistiques Saint-Paul-de-Vence | 3 190 | 7 km² | 456 h/km² | 42.7% | 3.9% | 29 400 €/an | 5 304 €/m² | 3.3 |
| Statistiques La Roquette-sur-Siagne | 5 552 | 6 km² | 925 h/km² | 48.9% | 5% | 27 510 €/an | 3 713 €/m² | 4.0 |
| Statistiques Le Rouret | 4 198 | 7 km² | 600 h/km² | 48% | 3.8% | 30 650 €/an | 3 911 €/m² | 3.9 |