Hôtel de ville
Auteur : Brumathechec
Signaler

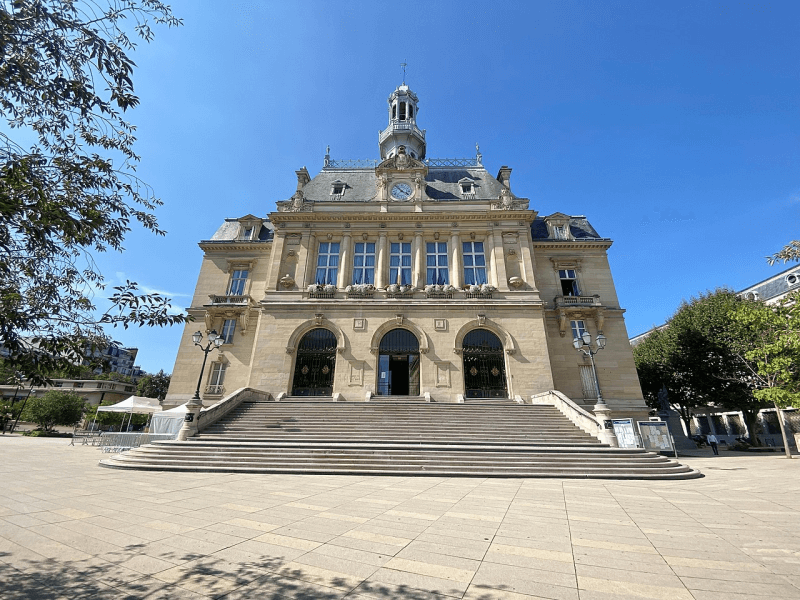
Hôtel de ville
Auteur : Brumathechec
Signaler
Quel est le profil de la population, sa situation démographique ?
| Nombre d'habitants | 91 457 | Classement |
| Age moyen | 37 ans | Classement |
| Pop active | 53.3% | Classement |
| Taux chômage | 7.9% | Classement |
| Pop densité | 22 864 h/km² | Classement |
| Revenu moyen | 28 370 €/an | Classement |
Quels sont les résultats des dernières élections aux présidentiels 2022 ?
 Emmanuel MACRON
 Jean-Luc MÉLENCHON
 Valérie PÉCRESSE
 Éric ZEMMOUR
 Marine LE PEN
 Yannick JADOT
 Anne HIDALGO
 Fabien ROUSSEL
 Jean LASSALLE
 Nicolas DUPONT-AIGNAN
 Philippe POUTOU
 Nathalie ARTHAUDEmmanuel MACRONMarine LE PEN
| Agressions physiques / sexuelles | 1 153 |
| Cambriolages | 219 |
| Vols / dégradations | 2 629 |
| Stupéfiants | 454 |
| Quartier | Habitants | Superficie | Pop densité | Pop active | Taux chômage | Revenu moyen | Note globale |
|---|---|---|---|---|---|---|---|
Alma-Philosophes |
14 711 | 0.6 km² | 24 518 h/km² | 56% | 4.7% | 28 332 €/an | 3.6 |
Becon-Flachat |
11 865 | 0.65 km² | 18 254 h/km² | 56% | 3.4% | 40 021 €/an | 3.6 |
Champs-Magenta |
9 790 | 0.55 km² | 17 800 h/km² | 55.1% | 4.3% | 41 138 €/an | 4.3 |
Gresillons |
13 059 | 1.13 km² | 11 557 h/km² | 59% | 6.9% | 15 999 €/an | 3.8 |
Mairie |
9 981 | 0.55 km² | 18 147 h/km² | 55.3% | 4.1% | 38 788 €/an | 3.2 |
Nord |
15 605 | 0.66 km² | 23 644 h/km² | 46% | 8.1% | 19 196 €/an | 2.9 |
Renoir-Metro |
12 993 | 0.71 km² | 18 300 h/km² | 54% | 7.3% | 24 853 €/an | 3.8 |
Commerce |
|
|---|---|
|
Hypermarché (1km) Levallois-Perret |
|
| Supermarché | 16 |
| Boulangerie | 56 |
| Boucherie | 33 |
| Station-service | 3 |
| Banque | 32 |
| La poste | 5 |
| Coiffeur | 105 |
| Vétérinaire | 9 |
| Restaurant | 252 |
Santé |
|
|---|---|
| Médecin | 162 |
| Dentiste | 96 |
| Pharmacie | 24 |
Éducation |
|
|---|---|
| Maternelle | 22 |
| Primaire | 20 |
| Collège | 7 |
| Lycée | 3 |
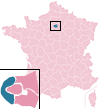
Carte de la ville de Asnières-sur-Seine

Achat / Vente / Location Votre agence immobilière à Asnières-sur-Seine

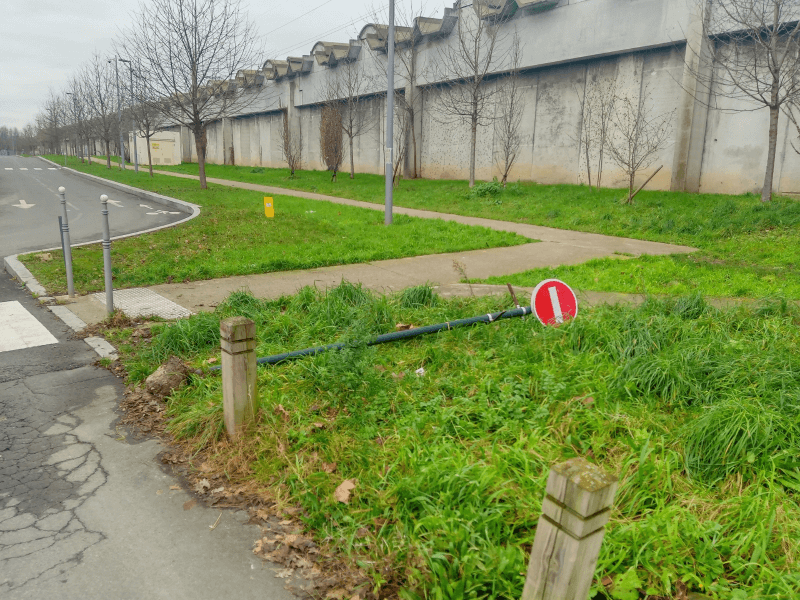
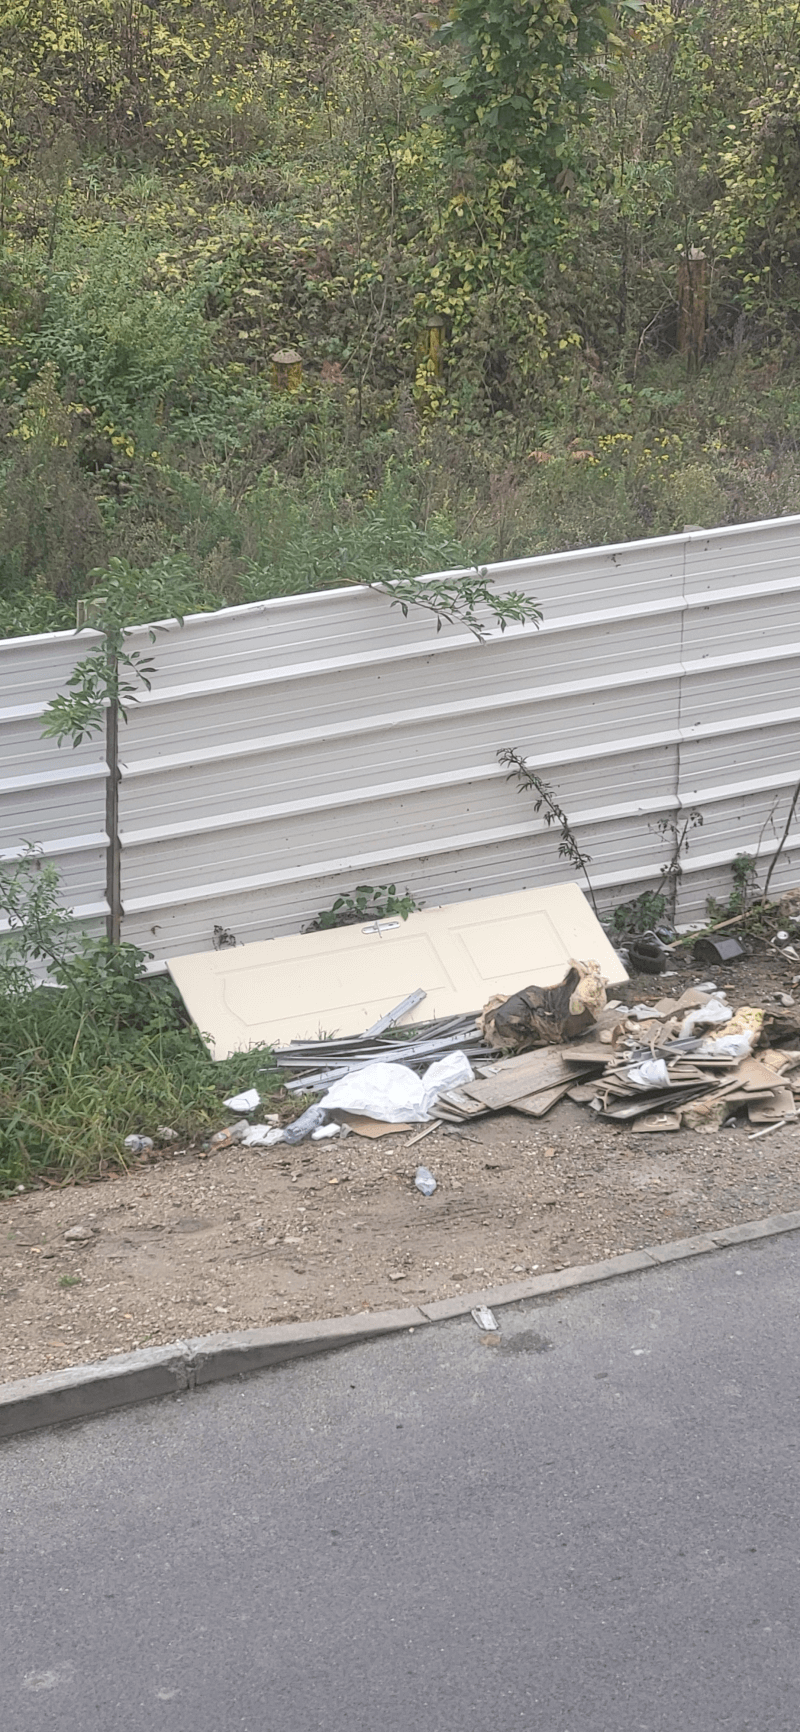
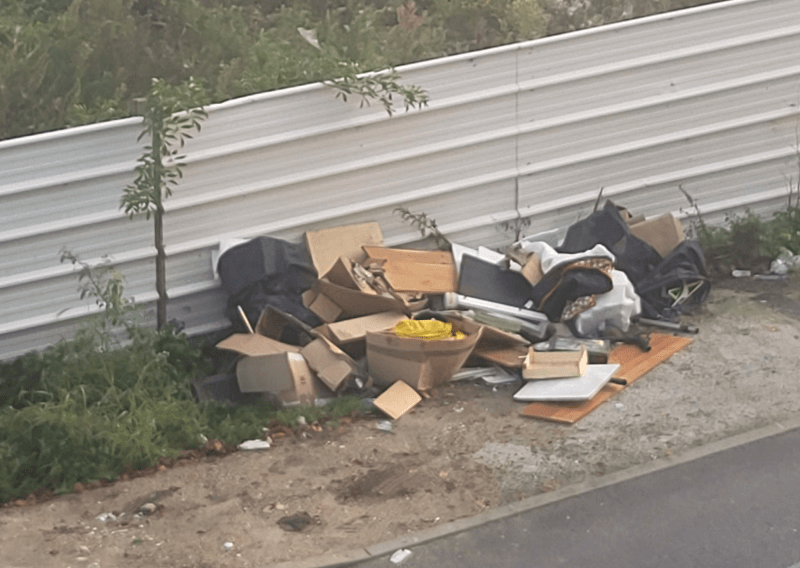
Les actes d'incivilités envahissent nos rues, agissons ! Un follow instagram = Un soutien
NOUVEAU : Décharges sauvages, détritus, objets abandonnés, graffitis, nids-de-poule : Déclarer un incident à Asnières-sur-Seine
| Ville | Habitants | Superficie | Pop densité | Pop active | Taux chômage | Revenu moyen | Prix immobilier | Note globale |
|---|---|---|---|---|---|---|---|---|
| Statistiques Levallois-Perret | 68 412 | 2 km² | 34 206 h/km² | 55% | 4.7% | 34 500 €/an | 9 093 €/m² | 4.0 |
| Statistiques Bois-Colombes | 29 376 | 1 km² | 29 376 h/km² | 55.3% | 4.8% | 32 650 €/an | 6 467 €/m² | 3.5 |
| Statistiques Clichy | 65 102 | 3 km² | 21 701 h/km² | 54.3% | 6.8% | 22 410 €/an | 6 352 €/m² | 3.3 |
| Statistiques Colombes | 90 692 | 7 km² | 12 956 h/km² | 49.7% | 5.9% | 25 100 €/an | 5 467 €/m² | 3.1 |
| Statistiques Gennevilliers | 50 874 | 11 km² | 4 625 h/km² | 45.3% | 8.7% | 18 380 €/an | 4 213 €/m² | 2.6 |
| Statistiques La Garenne-Colombes | 29 828 | 1 km² | 29 828 h/km² | 56.5% | 4.3% | 33 090 €/an | 6 583 €/m² | 3.9 |
| Statistiques Courbevoie | 81 945 | 4 km² | 20 486 h/km² | 55.2% | 4.9% | 32 080 €/an | 6 690 €/m² | 3.4 |
| Statistiques Neuilly-sur-Seine | 59 200 | 3 km² | 19 733 h/km² | 46.6% | 4% | 48 010 €/an | 10 306 €/m² | 4.0 |
| Statistiques Saint-Ouen-sur-Seine | 53 041 | 4 km² | 13 260 h/km² | 53.8% | 8.9% | 20 440 €/an | 5 781 €/m² | 3.0 |
| Statistiques Villeneuve-la-Garenne | 25 566 | 3 km² | 8 522 h/km² | 43.7% | 8.1% | 18 570 €/an | 3 397 €/m² | 3.3 |
| Statistiques L'Île-Saint-Denis | 8 682 | 1 km² | 8 682 h/km² | 46.1% | 7.3% | 17 740 €/an | 3 315 €/m² | 2.2 |
| Statistiques Épinay-sur-Seine | 53 564 | 4 km² | 13 391 h/km² | 46.3% | 8% | 17 880 €/an | 2 781 €/m² | 2.9 |
| Statistiques Argenteuil | 107 135 | 17 km² | 6 302 h/km² | 47.9% | 7.3% | 19 350 €/an | 3 342 €/m² | 1.9 |
| Statistiques Bezons | 34 314 | 4 km² | 8 579 h/km² | 48.2% | 6.2% | 21 450 €/an | 4 302 €/m² | 2.7 |
| Statistiques Saint-Denis | 115 237 | 12 km² | 9 603 h/km² | 47.9% | 9.6% | 16 620 €/an | 3 775 €/m² | 2.3 |