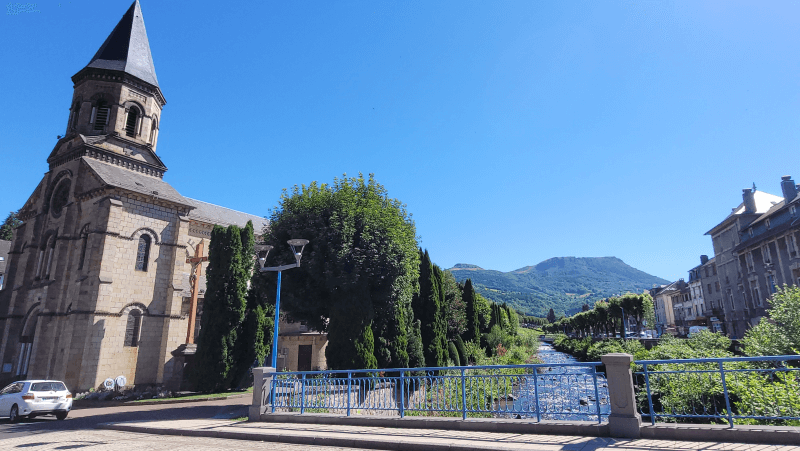
Pont Dordogne
Auteur : Elo
Signaler

Pont Dordogne
Auteur : Elo
Signaler
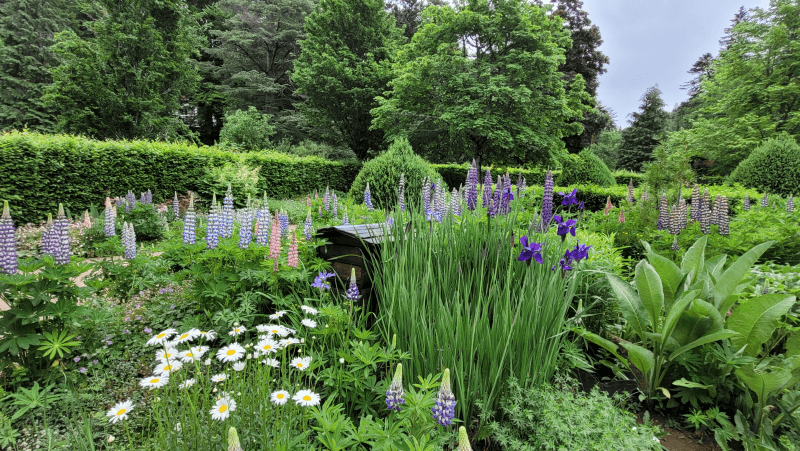
Parc fenestre
Auteur : Elo
Signaler
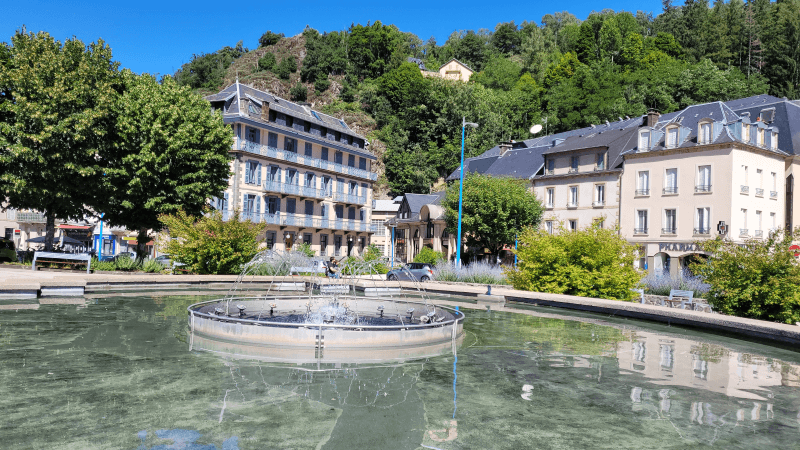
Place du jet d'eau
Auteur : Elo
Signaler
Le Richelieu
Auteur : Elo
Signaler
Quel est le profil de la population, sa situation démographique ?
| Nombre d'habitants | 1 739 | Classement |
| Age moyen | 47 ans | Classement |
| Pop active | 45.6% | Classement |
| Taux chômage | 10.4% | Classement |
| Pop densité | 145 h/km² | Classement |
| Revenu moyen | 20 250 €/an | Classement |
Quels sont les résultats des dernières élections aux présidentiels 2022 ?
 Emmanuel MACRON
 Marine LE PEN
 Jean-Luc MÉLENCHON
 Valérie PÉCRESSE
 Éric ZEMMOUR
 Jean LASSALLE
 Yannick JADOT
 Nicolas DUPONT-AIGNAN
 Fabien ROUSSEL
 Anne HIDALGO
 Philippe POUTOU
 Nathalie ARTHAUDEmmanuel MACRONMarine LE PEN
| Agressions physiques / sexuelles | 0 |
| Cambriolages | 0 |
| Vols / dégradations | 21 |
| Stupéfiants | 0 |
Commerce |
|
|---|---|
|
Hypermarché (28km) Bort-les-Orgues |
|
| Supermarché | 2 |
| Boulangerie | 6 |
| Boucherie | 1 |
| Station-service | 1 |
| Banque | 3 |
| La poste | 1 |
| Coiffeur | 4 |
|
Vétérinaire (5km) Mont-Dore |
|
| Restaurant | 19 |
Santé |
|
|---|---|
| Médecin | 9 |
| Dentiste | 1 |
| Pharmacie | 2 |
Éducation |
|
|---|---|
| Maternelle | 1 |
| Primaire | 1 |
|
Collège (2km) Murat-le-Quaire |
|
|
Lycée (12km) Rochefort-Montagne |
|
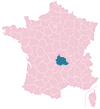
Carte de la ville de La Bourboule

Achat / Vente / Location Votre agence immobilière à La Bourboule

Les actes d'incivilités envahissent nos rues, agissons ! Un follow instagram = Un soutien
NOUVEAU : Décharges sauvages, détritus, objets abandonnés, graffitis, nids-de-poule : Déclarer un incident à La Bourboule


| Ville | Habitants | Superficie | Pop densité | Pop active | Taux chômage | Revenu moyen | Prix immobilier | Note globale |
|---|---|---|---|---|---|---|---|---|
| Statistiques Murat-le-Quaire | 486 | 11 km² | 44 h/km² | 52.5% | 4.5% | 22 630 €/an | 1 480 €/m² | 4.9 |
| Statistiques Mont-Dore | 1 200 | 35 km² | 34 h/km² | 47.2% | 2.6% | 21 740 €/an | 1 872 €/m² | 2.9 |
| Statistiques Saint-Sauves-d'Auvergne | 1 128 | 49 km² | 23 h/km² | 47% | 3.1% | 21 780 €/an | 1 240 €/m² | - |
| Statistiques La Tour-d'Auvergne | 631 | 48 km² | 13 h/km² | 43.3% | 2.2% | 20 540 €/an | 804 €/m² | 5.0 |
| Statistiques Chastreix | 233 | 45 km² | 5 h/km² | 46.4% | 3% | 22 120 €/an | 1 508 €/m² | - |
| Statistiques Laqueuille | 351 | 22 km² | 16 h/km² | 52.1% | 2.8% | 20 120 €/an | 667 €/m² | 4.0 |
| Statistiques Tauves | 700 | 34 km² | 21 h/km² | 43.9% | 4% | 20 580 €/an | 1 068 €/m² | - |
| Statistiques Saint-Julien-Puy-Lavèze | 363 | 29 km² | 13 h/km² | 49.6% | 2.5% | 21 670 €/an | 1 930 €/m² | - |
| Statistiques Perpezat | 422 | 36 km² | 12 h/km² | 48.6% | 3.3% | 20 960 €/an | 1 486 €/m² | - |
| Statistiques Saint-Sulpice | 85 | 18 km² | 5 h/km² | 43.5% | 1.2% | NC | 833 €/m² | - |
| Statistiques Avèze | 159 | 22 km² | 7 h/km² | 42.8% | 3.1% | 19 380 €/an | 891 €/m² | - |
| Statistiques Chambon-sur-Lac | 407 | 46 km² | 9 h/km² | 48.6% | 4.2% | 23 120 €/an | 2 150 €/m² | 3.8 |
| Statistiques Rochefort-Montagne | 846 | 17 km² | 50 h/km² | 44.4% | 2.5% | 21 700 €/an | 1 371 €/m² | - |
| Statistiques Bagnols | 402 | 42 km² | 10 h/km² | 38.6% | 2% | 18 130 €/an | 909 €/m² | - |
| Statistiques Saint-Donat | 198 | 33 km² | 6 h/km² | 46% | 1% | 17 150 €/an | 1 500 €/m² | - |