Hôtel de ville
Auteur : Chabe01
Signaler

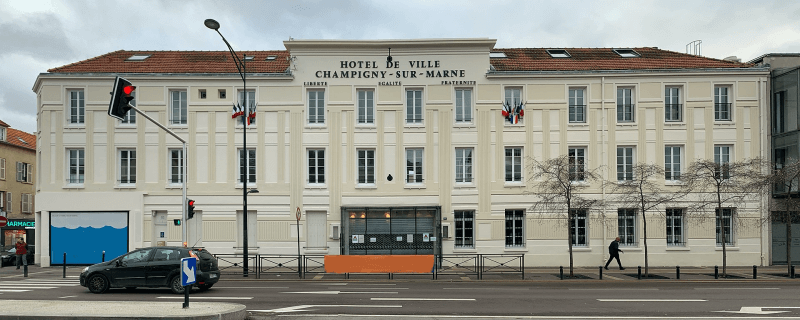
Hôtel de ville
Auteur : Chabe01
Signaler
Quel est le profil de la population, sa situation démographique ?
| Nombre d'habitants | 78 367 | Classement |
| Age moyen | 38 ans | Classement |
| Pop active | 47.8% | Classement |
| Taux chômage | 9.8% | Classement |
| Pop densité | 7 124 h/km² | Classement |
| Revenu moyen | 21 260 €/an | Classement |
Quels sont les résultats des dernières élections aux présidentiels 2022 ?
 Jean-Luc MÉLENCHON
 Emmanuel MACRON
 Marine LE PEN
 Éric ZEMMOUR
 Valérie PÉCRESSE
 Yannick JADOT
 Fabien ROUSSEL
 Nicolas DUPONT-AIGNAN
 Jean LASSALLE
 Anne HIDALGO
 Philippe POUTOU
 Nathalie ARTHAUDEmmanuel MACRONMarine LE PEN
| Agressions physiques / sexuelles | 1 264 |
| Cambriolages | 184 |
| Vols / dégradations | 1 781 |
| Stupéfiants | 551 |
| Quartier | Habitants | Superficie | Pop densité | Pop active | Taux chômage | Revenu moyen | Note globale |
|---|---|---|---|---|---|---|---|
Bois l’Abbé |
7 214 | 0.27 km² | 26 719 h/km² | 40.3% | 8.8% | 12 784 €/an | 0.0 |
Centre |
5 903 | 0.62 km² | 9 521 h/km² | 50.2% | 7.7% | 20 430 €/an | 3.7 |
Coeuilly |
10 407 | 1.95 km² | 5 337 h/km² | 48.2% | 4.9% | 25 635 €/an | 4.0 |
Coteaux |
4 005 | 0.72 km² | 5 563 h/km² | 51% | 5.7% | 25 205 €/an | 3.6 |
Maroc |
5 160 | 0.52 km² | 9 923 h/km² | 51.7% | 5.5% | 23 210 €/an | 4.2 |
Mordacs |
6 113 | 0.53 km² | 11 534 h/km² | 45.9% | 8.9% | 13 128 €/an | 2.1 |
Perroquets |
2 138 | 0.21 km² | 10 181 h/km² | 42.3% | 5.9% | 18 640 €/an | 2.9 |
Plant |
8 245 | 1.08 km² | 7 634 h/km² | 51.8% | 6.4% | 24 473 €/an | 2.8 |
Plateau |
2 872 | 0.42 km² | 6 838 h/km² | 47.1% | 8.4% | 16 140 €/an | 3.3 |
Quatre Cités |
7 851 | 0.61 km² | 12 870 h/km² | 48% | 8.4% | 14 308 €/an | 2.4 |
Remise Saint-Maur |
5 008 | 0.63 km² | 7 949 h/km² | 49% | 4.2% | 24 570 €/an | 3.8 |
République |
3 414 | 0.47 km² | 7 264 h/km² | 50.6% | 5.9% | 18 170 €/an | 4.0 |
Tremblay |
6 595 | 2.05 km² | 3 217 h/km² | 50% | 6.4% | 23 790 €/an | 3.2 |
Zone Industrielle |
2 511 | 1.25 km² | 2 009 h/km² | 52% | 6.5% | 18 570 €/an | - |
Commerce |
|
|---|---|
| Hypermarché | 1 |
| Supermarché | 9 |
| Boulangerie | 48 |
| Boucherie | 14 |
| Station-service | 4 |
| Banque | 21 |
| La poste | 5 |
| Coiffeur | 71 |
| Vétérinaire | 5 |
| Restaurant | 189 |
Santé |
|
|---|---|
| Médecin | 357 |
| Dentiste | 76 |
| Pharmacie | 28 |
Éducation |
|
|---|---|
| Maternelle | 37 |
| Primaire | 18 |
| Collège | 6 |
| Lycée | 7 |
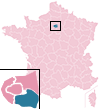
Carte de la ville de Champigny-sur-Marne

Achat / Vente / Location Votre agence immobilière à Champigny-sur-Marne

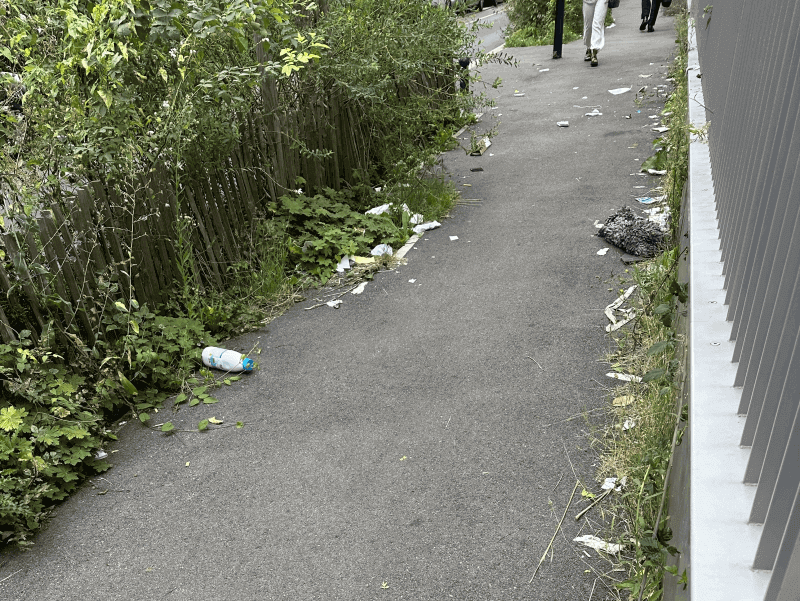
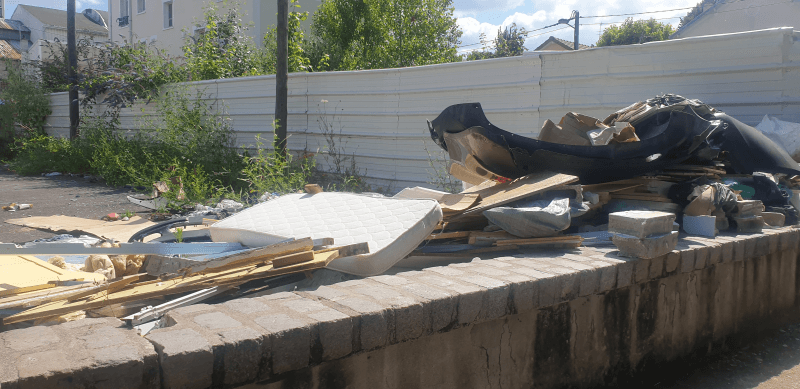
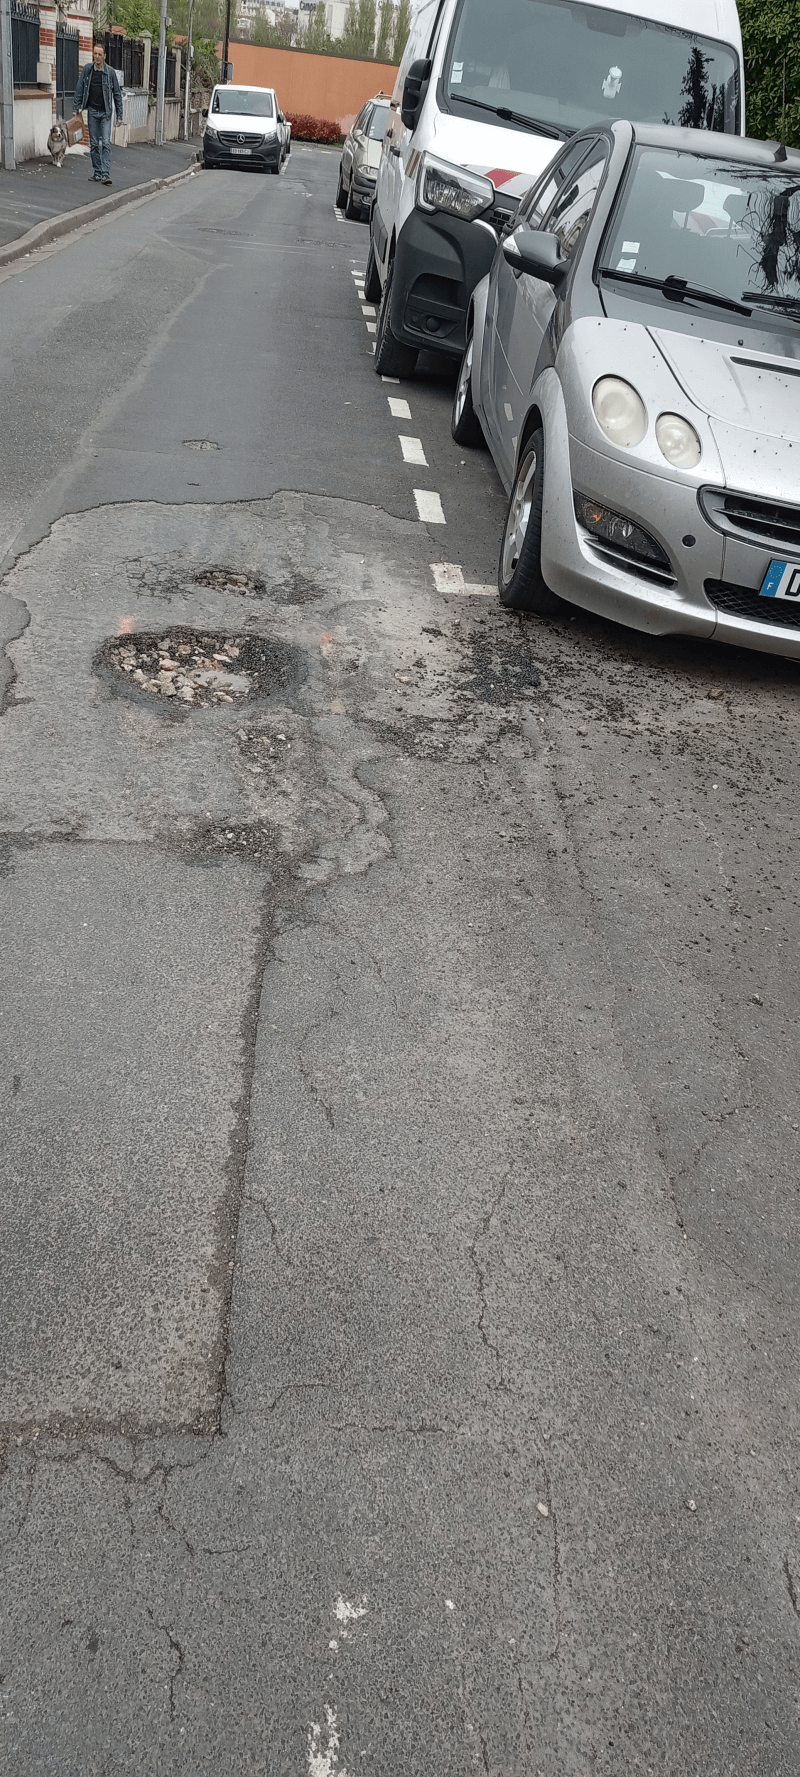
Les actes d'incivilités envahissent nos rues, agissons ! Un follow instagram = Un soutien
NOUVEAU : Décharges sauvages, détritus, objets abandonnés, graffitis, nids-de-poule : Déclarer un incident à Champigny-sur-Marne
| Ville | Habitants | Superficie | Pop densité | Pop active | Taux chômage | Revenu moyen | Prix immobilier | Note globale |
|---|---|---|---|---|---|---|---|---|
| Statistiques Bry-sur-Marne | 18 095 | 3 km² | 6 032 h/km² | 48.2% | 4.2% | 31 250 €/an | 5 085 €/m² | 4.0 |
| Statistiques Chennevières-sur-Marne | 18 295 | 5 km² | 3 659 h/km² | 50% | 6.9% | 23 910 €/an | 3 539 €/m² | 3.0 |
| Statistiques Trégastel | 2 532 | 7 km² | 362 h/km² | 32.6% | 3.6% | 25 800 €/an | 2 491 €/m² | 4.2 |
| Statistiques Saint-Maur-des-Fossés | 76 010 | 11 km² | 6 910 h/km² | 48.8% | 3.8% | 32 730 €/an | 5 699 €/m² | 3.9 |
| Statistiques Villiers-sur-Marne | 32 547 | 4 km² | 8 137 h/km² | 47.6% | 4.4% | 24 020 €/an | 3 835 €/m² | 3.3 |
| Statistiques Nogent-sur-Marne | 32 998 | 2 km² | 16 499 h/km² | 52.5% | 4.8% | 33 240 €/an | 6 210 €/m² | 4.0 |
| Statistiques Le Plessis-Trévise | 21 096 | 4 km² | 5 274 h/km² | 46.8% | 4.7% | 26 100 €/an | 3 689 €/m² | 4.0 |
| Statistiques Joinville-le-Pont | 20 784 | 2 km² | 10 392 h/km² | 49.4% | 5.1% | 29 100 €/an | 5 825 €/m² | 4.2 |
| Statistiques Neuilly-sur-Marne | 38 799 | 6 km² | 6 467 h/km² | 46.2% | 5.4% | 21 000 €/an | 3 191 €/m² | 3.4 |
| Statistiques Le Perreux-sur-Marne | 34 654 | 4 km² | 8 664 h/km² | 51% | 4.3% | 31 180 €/an | 5 349 €/m² | 3.7 |
| Statistiques Saint-Maurice | 14 411 | 1 km² | 14 411 h/km² | 53.4% | 5.7% | 28 510 €/an | 5 860 €/m² | 3.9 |
| Statistiques Fontenay-sous-Bois | 52 646 | 5 km² | 10 529 h/km² | 49.9% | 5.5% | 25 750 €/an | 5 850 €/m² | 3.5 |
| Statistiques Noiseau | 4 619 | 4 km² | 1 155 h/km² | 49.8% | 3.6% | 28 950 €/an | 3 980 €/m² | 4.0 |
| Statistiques Ormesson-sur-Marne | 10 589 | 3 km² | 3 530 h/km² | 46.2% | 3.7% | 29 610 €/an | 4 034 €/m² | 3.5 |
| Statistiques Noisy-le-Grand | 71 632 | 13 km² | 5 510 h/km² | 49.6% | 6.3% | 23 490 €/an | 3 866 €/m² | 3.7 |