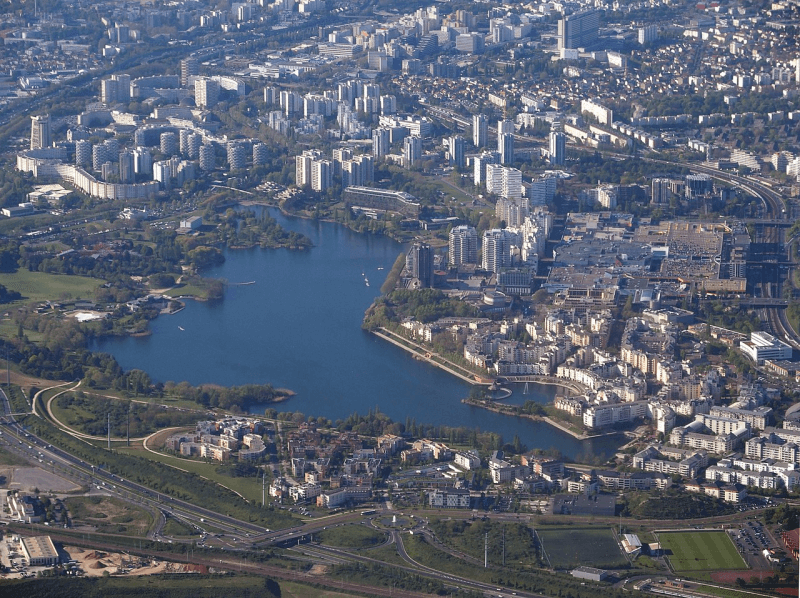
Lac de Créteil
Auteur : Suaudeau
Signaler

Lac de Créteil
Auteur : Suaudeau
Signaler
Quel est le profil de la population, sa situation démographique ?
| Nombre d'habitants | 92 859 | Classement |
| Age moyen | 37 ans | Classement |
| Pop active | 49.3% | Classement |
| Taux chômage | 10.1% | Classement |
| Pop densité | 8 442 h/km² | Classement |
| Revenu moyen | 21 270 €/an | Classement |
Quels sont les résultats des dernières élections aux présidentiels 2022 ?
 Jean-Luc MÉLENCHON
 Emmanuel MACRON
 Marine LE PEN
 Éric ZEMMOUR
 Valérie PÉCRESSE
 Yannick JADOT
 Fabien ROUSSEL
 Nicolas DUPONT-AIGNAN
 Jean LASSALLE
 Anne HIDALGO
 Philippe POUTOU
 Nathalie ARTHAUDEmmanuel MACRONMarine LE PEN
| Agressions physiques / sexuelles | 1 659 |
| Cambriolages | 304 |
| Vols / dégradations | 3 545 |
| Stupéfiants | 675 |
| Quartier | Habitants | Superficie | Pop densité | Pop active | Taux chômage | Revenu moyen | Note globale |
|---|---|---|---|---|---|---|---|
Bordières |
19 564 | 1.99 km² | 9 831 h/km² | 51% | 5.7% | 22 983 €/an | 2.1 |
Centre Ancien |
10 478 | 1.44 km² | 7 276 h/km² | 47.7% | 4.7% | 27 212 €/an | 3.7 |
Le Mont-Mesly |
25 365 | 2.09 km² | 12 136 h/km² | 47.6% | 8% | 16 350 €/an | 3.1 |
Nouvelle Ville |
37 161 | 5.92 km² | 6 277 h/km² | 49.7% | 7.1% | 21 409 €/an | 3.5 |
Commerce |
|
|---|---|
| Hypermarché | 1 |
| Supermarché | 14 |
| Boulangerie | 33 |
| Boucherie | 20 |
| Station-service | 8 |
| Banque | 37 |
| La poste | 5 |
| Coiffeur | 61 |
| Vétérinaire | 17 |
| Restaurant | 230 |
Santé |
|
|---|---|
| Médecin | 1739 |
| Dentiste | 159 |
| Pharmacie | 32 |
Éducation |
|
|---|---|
| Maternelle | 43 |
| Primaire | 27 |
| Collège | 11 |
| Lycée | 11 |
Carte de la ville de Créteil

Achat / Vente / Location Votre agence immobilière à Créteil

Les actes d'incivilités envahissent nos rues, agissons ! Un follow instagram = Un soutien
NOUVEAU : Décharges sauvages, détritus, objets abandonnés, graffitis, nids-de-poule : Déclarer un incident à Créteil


| Ville | Habitants | Superficie | Pop densité | Pop active | Taux chômage | Revenu moyen | Prix immobilier | Note globale |
|---|---|---|---|---|---|---|---|---|
| Statistiques Bonneuil-sur-Marne | 18 340 | 5 km² | 3 668 h/km² | 47.3% | 7.8% | 19 530 €/an | 3 626 €/m² | 3.3 |
| Statistiques Saint-Maur-des-Fossés | 76 010 | 11 km² | 6 910 h/km² | 48.8% | 3.8% | 32 730 €/an | 5 699 €/m² | 3.9 |
| Statistiques Maisons-Alfort | 57 422 | 5 km² | 11 484 h/km² | 54.3% | 5% | 28 010 €/an | 5 407 €/m² | 3.9 |
| Statistiques Valenton | 14 453 | 5 km² | 2 891 h/km² | 46.1% | 7.4% | 17 690 €/an | 3 165 €/m² | 3.8 |
| Statistiques Joinville-le-Pont | 20 784 | 2 km² | 10 392 h/km² | 49.4% | 5.1% | 29 100 €/an | 5 825 €/m² | 4.2 |
| Statistiques Saint-Maurice | 14 411 | 1 km² | 14 411 h/km² | 53.4% | 5.7% | 28 510 €/an | 5 860 €/m² | 3.9 |
| Statistiques Trégastel | 2 532 | 7 km² | 362 h/km² | 32.6% | 3.6% | 25 800 €/an | 2 491 €/m² | 4.2 |
| Statistiques Choisy-le-Roi | 46 122 | 5 km² | 9 224 h/km² | 50.8% | 7.3% | 20 840 €/an | 3 700 €/m² | 2.9 |
| Statistiques Alfortville | 45 569 | 3 km² | 15 190 h/km² | 51.3% | 7.3% | 22 360 €/an | 4 906 €/m² | 2.9 |
| Statistiques Chennevières-sur-Marne | 18 295 | 5 km² | 3 659 h/km² | 50% | 6.9% | 23 910 €/an | 3 539 €/m² | 3.0 |
| Statistiques Vitry-sur-Seine | 95 282 | 11 km² | 8 662 h/km² | 48.2% | 7.2% | 19 490 €/an | 4 125 €/m² | 2.2 |
| Statistiques Boissy-Saint-Léger | 17 335 | 8 km² | 2 167 h/km² | 49.6% | 6.8% | 21 400 €/an | 3 174 €/m² | 3.2 |
| Statistiques Charenton-le-Pont | 28 756 | 1 km² | 28 756 h/km² | 53.3% | 4.6% | 30 250 €/an | 7 402 €/m² | 3.9 |
| Statistiques Champigny-sur-Marne | 78 367 | 11 km² | 7 124 h/km² | 47.8% | 6.3% | 21 260 €/an | 3 837 €/m² | 3.1 |
| Statistiques Sucy-en-Brie | 27 593 | 10 km² | 2 759 h/km² | 47.1% | 4.6% | 28 120 €/an | 3 887 €/m² | 3.5 |