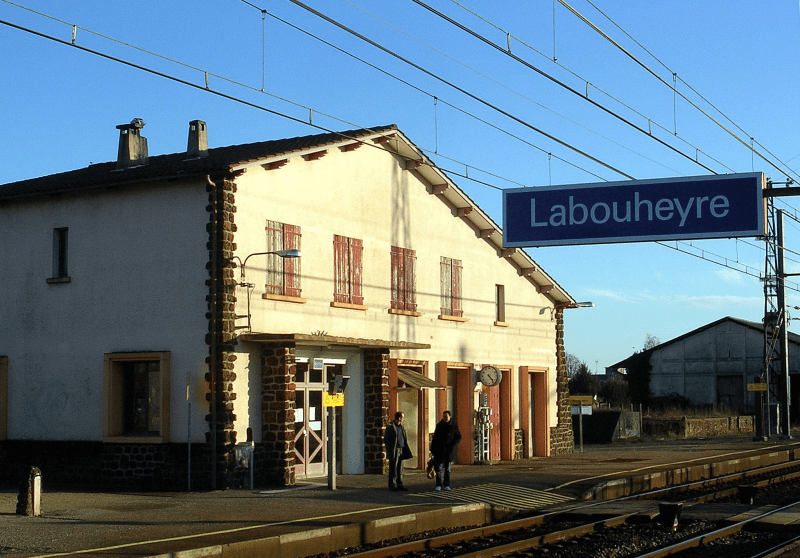
La poste
Auteur : France
Signaler

La poste
Auteur : France
Signaler
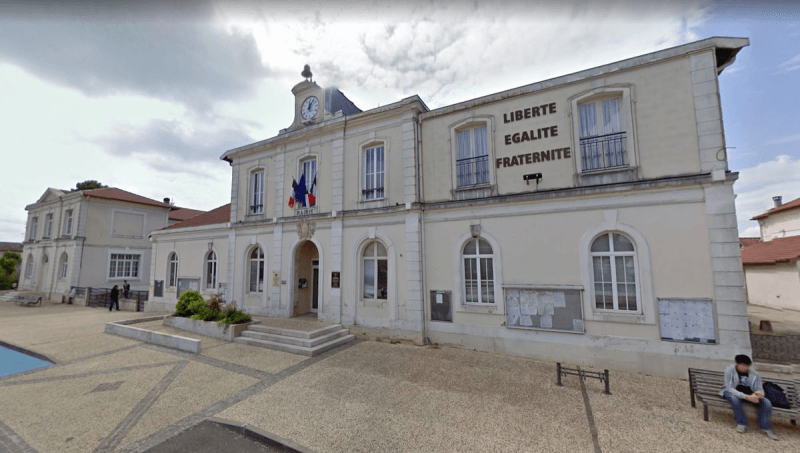
Mairie
Auteur : Damien
Signaler
Quel est le profil de la population, sa situation démographique ?
| Nombre d'habitants | 2 883 | Classement |
| Age moyen | 44 ans | Classement |
| Pop active | 42.1% | Classement |
| Taux chômage | 11.6% | Classement |
| Pop densité | 80 h/km² | Classement |
| Revenu moyen | 19 870 €/an | Classement |
Quels sont les résultats des dernières élections aux présidentiels 2022 ?
 Marine LE PEN
 Emmanuel MACRON
 Jean-Luc MÉLENCHON
 Jean LASSALLE
 Éric ZEMMOUR
 Anne HIDALGO
 Valérie PÉCRESSE
 Fabien ROUSSEL
 Yannick JADOT
 Nicolas DUPONT-AIGNAN
 Philippe POUTOU
 Nathalie ARTHAUDEmmanuel MACRONMarine LE PEN
| Agressions physiques / sexuelles | 64 |
| Cambriolages | 14 |
| Vols / dégradations | 33 |
| Stupéfiants | 13 |
Commerce |
|
|---|---|
|
Hypermarché (19km) Parentis-en-Born |
|
| Supermarché | 2 |
| Boulangerie | 1 |
| Boucherie | 2 |
| Station-service | 1 |
| Banque | 3 |
| La poste | 1 |
| Coiffeur | 4 |
|
Vétérinaire (11km) Escource |
|
| Restaurant | 8 |
Santé |
|
|---|---|
| Médecin | 5 |
| Dentiste | 2 |
| Pharmacie | 1 |
Éducation |
|
|---|---|
| Maternelle | 1 |
| Primaire | 2 |
| Collège | 1 |
|
Lycée (16km) Sabres |
|
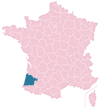
Carte de la ville de Labouheyre

Achat / Vente / Location Votre agence immobilière à Labouheyre

Les actes d'incivilités envahissent nos rues, agissons ! Un follow instagram = Un soutien
NOUVEAU : Décharges sauvages, détritus, objets abandonnés, graffitis, nids-de-poule : Déclarer un incident à Labouheyre


| Ville | Habitants | Superficie | Pop densité | Pop active | Taux chômage | Revenu moyen | Prix immobilier | Note globale |
|---|---|---|---|---|---|---|---|---|
| Statistiques Lüe | 613 | 96 km² | 6 h/km² | 43.7% | 4.9% | 21 170 €/an | 2 872 €/m² | - |
| Statistiques Solférino | 361 | 97 km² | 4 h/km² | 47.1% | 4.4% | 21 240 €/an | 2 857 €/m² | - |
| Statistiques Commensacq | 434 | 71 km² | 6 h/km² | 45.4% | 7.8% | 21 580 €/an | 1 981 €/m² | - |
| Statistiques Escource | 799 | 102 km² | 8 h/km² | 44.3% | 4.8% | 22 140 €/an | 1 811 €/m² | 4.4 |
| Statistiques Liposthey | 591 | 24 km² | 25 h/km² | 52.5% | 3.6% | 23 240 €/an | 2 020 €/m² | - |
| Statistiques Trensacq | 285 | 79 km² | 4 h/km² | 42.8% | 4.2% | 20 930 €/an | 1 637 €/m² | - |
| Statistiques Ychoux | 2 342 | 111 km² | 21 h/km² | 43.8% | 5.6% | 22 660 €/an | 2 425 €/m² | 4.2 |
| Statistiques Pissos | 1 483 | 140 km² | 11 h/km² | 44.2% | 7.2% | 22 200 €/an | 1 971 €/m² | 4.0 |
| Statistiques Pontenx-les-Forges | 1 737 | 80 km² | 22 h/km² | 42.6% | 5.5% | 21 820 €/an | 2 012 €/m² | - |
| Statistiques Sabres | 1 191 | 160 km² | 7 h/km² | 41.9% | 8.6% | 21 110 €/an | 1 636 €/m² | - |
| Statistiques Parentis-en-Born | 7 463 | 111 km² | 67 h/km² | 43.5% | 4.3% | 23 290 €/an | 2 274 €/m² | 3.4 |
| Statistiques Moustey | 755 | 67 km² | 11 h/km² | 47% | 5.6% | 20 950 €/an | 1 990 €/m² | 3.2 |
| Statistiques Morcenx-la-Nouvelle | 5 005 | 138 km² | 36 h/km² | 38.3% | 5% | 21 450 €/an | 1 627 €/m² | 2.7 |
| Statistiques Onesse-Laharie | 1 057 | 132 km² | 8 h/km² | 37.1% | 4.5% | 22 500 €/an | 1 808 €/m² | 3.2 |
| Statistiques Luglon | 375 | 41 km² | 9 h/km² | 43.7% | 5.3% | 22 650 €/an | 1 665 €/m² | - |