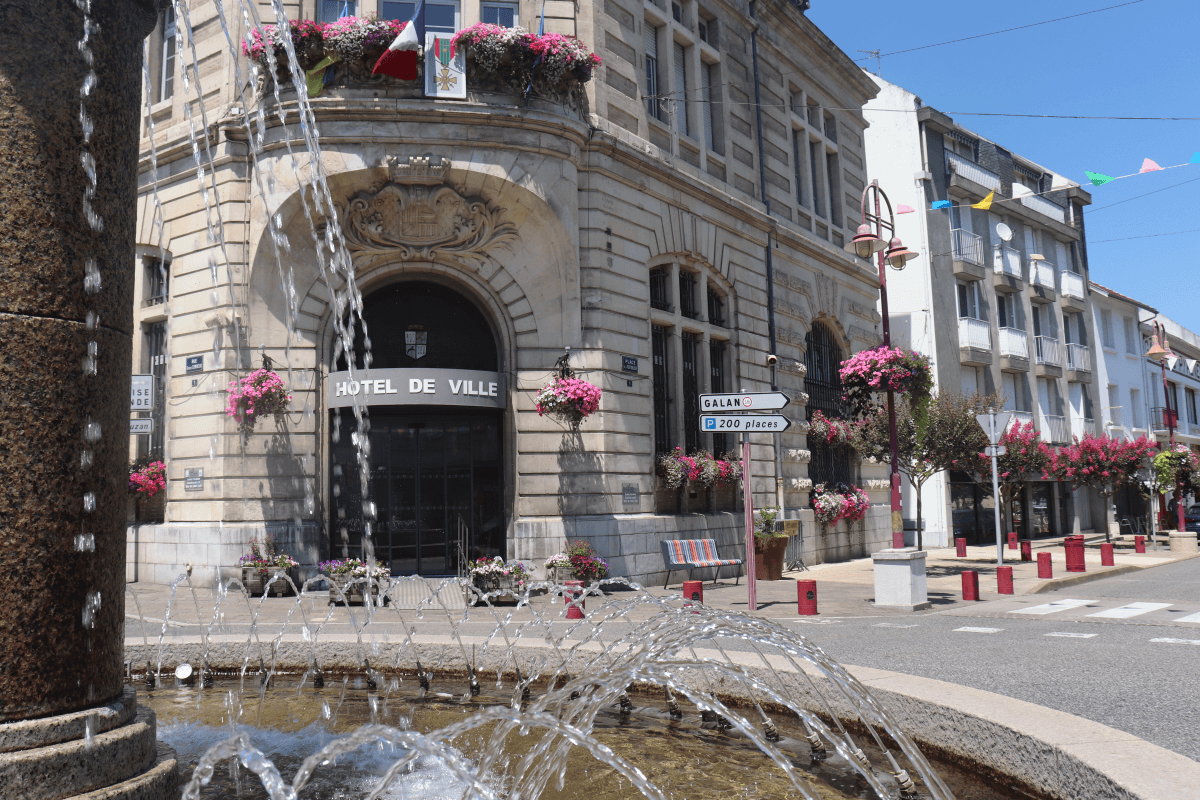
Place de la République
Auteur : Cécile
Signaler

Place de la République
Auteur : Cécile
Signaler
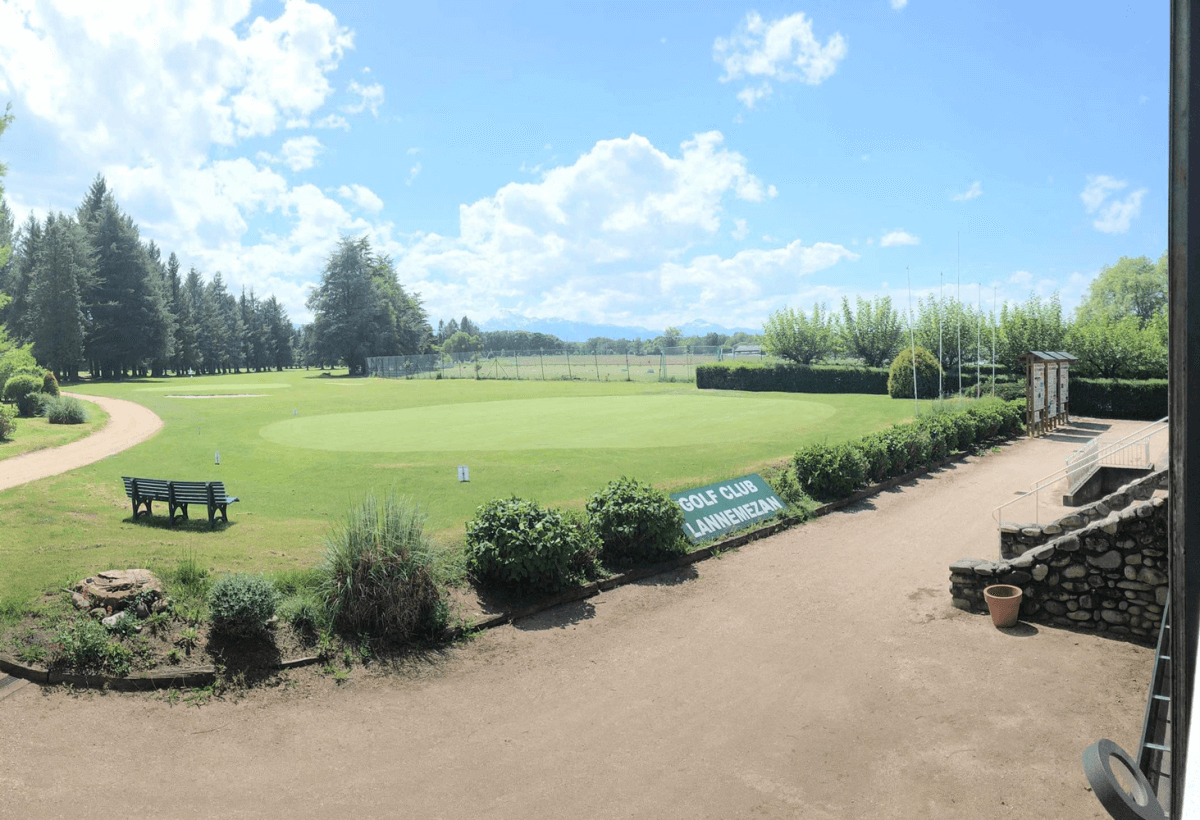
Golf
Auteur : Cécile
Signaler
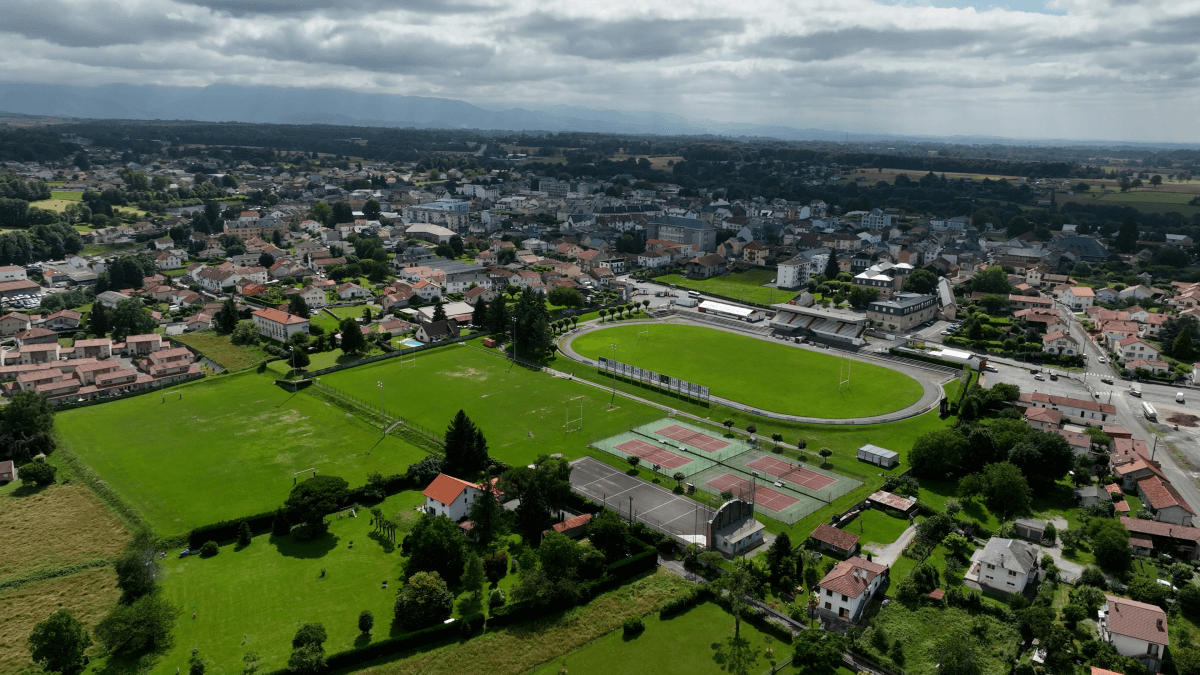
Ville sportive
Auteur : Cécile
Signaler
Route de la Barthe de Neste
Auteur : Cécile
Signaler
Quel est le profil de la population, sa situation démographique ?
| Nombre d'habitants | 5 810 | Classement |
| Age moyen | 48 ans | Classement |
| Pop active | 38% | Classement |
| Taux chômage | 8.3% | Classement |
| Pop densité | 306 h/km² | Classement |
| Revenu moyen | 20 400 €/an | Classement |
Quels sont les résultats des dernières élections aux présidentiels 2022 ?
 Marine LE PEN
 Emmanuel MACRON
 Jean-Luc MÉLENCHON
 Jean LASSALLE
 Éric ZEMMOUR
 Yannick JADOT
 Valérie PÉCRESSE
 Fabien ROUSSEL
 Anne HIDALGO
 Nicolas DUPONT-AIGNAN
 Philippe POUTOU
 Nathalie ARTHAUDEmmanuel MACRONMarine LE PEN
| Agressions physiques / sexuelles | 111 |
| Cambriolages | 15 |
| Vols / dégradations | 162 |
| Stupéfiants | 64 |
Commerce |
|
|---|---|
|
Hypermarché (18km) Gourdan-Polignan |
|
| Supermarché | 2 |
| Boulangerie | 7 |
| Boucherie | 4 |
| Station-service | 2 |
| Banque | 8 |
| La poste | 1 |
| Coiffeur | 19 |
| Vétérinaire | 6 |
| Restaurant | 25 |
Santé |
|
|---|---|
| Médecin | 101 |
| Dentiste | 6 |
| Pharmacie | 6 |
Éducation |
|
|---|---|
| Maternelle | 4 |
| Primaire | 4 |
| Collège | 1 |
| Lycée | 1 |
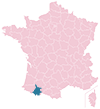
Carte de la ville de Lannemezan

Achat / Vente / Location Votre agence immobilière à Lannemezan

Les actes d'incivilités envahissent nos rues, agissons ! Un follow instagram = Un soutien
NOUVEAU : Décharges sauvages, détritus, objets abandonnés, graffitis, nids-de-poule : Déclarer un incident à Lannemezan


| Ville | Habitants | Superficie | Pop densité | Pop active | Taux chômage | Revenu moyen | Prix immobilier | Note globale |
|---|---|---|---|---|---|---|---|---|
| Statistiques Campistrous | 314 | 10 km² | 31 h/km² | 40.4% | 3.2% | 24 670 €/an | 1 522 €/m² | - |
| Statistiques Grange | 255 | 3 km² | 85 h/km² | 44.3% | 3.9% | 24 010 €/an | 1 384 €/m² | - |
| Statistiques Uglas | 274 | 8 km² | 34 h/km² | 40.1% | 2.9% | 23 350 €/an | 855 €/m² | - |
| Statistiques Lutilhous | 214 | 3 km² | 71 h/km² | 49.5% | 4.7% | 24 650 €/an | 1 336 €/m² | - |
| Statistiques Pinas | 445 | 5 km² | 89 h/km² | 41.1% | 4.5% | 22 940 €/an | 1 478 €/m² | - |
| Statistiques Bégole | 191 | 10 km² | 19 h/km² | 45.5% | 2.6% | 22 370 €/an | 1 288 €/m² | 2.8 |
| Statistiques Houeydets | 284 | 7 km² | 41 h/km² | 47.9% | 3.9% | 22 410 €/an | 1 186 €/m² | - |
| Statistiques Clarens | 502 | 11 km² | 46 h/km² | 44.8% | 1.2% | 24 070 €/an | 1 537 €/m² | - |
| Statistiques Caharet | 30 | 1 km² | 30 h/km² | 46.7% | 6.7% | NC | NC | - |
| Statistiques La Barthe-de-Neste | 1 245 | 7 km² | 178 h/km² | 43.1% | 3.9% | 22 760 €/an | 1 636 €/m² | - |
| Statistiques Réjaumont | 150 | 6 km² | 25 h/km² | 42% | 2.7% | 22 520 €/an | 1 430 €/m² | - |
| Statistiques Galez | 176 | 7 km² | 25 h/km² | 43.8% | 1.7% | 21 070 €/an | 2 313 €/m² | - |
| Statistiques Escala | 351 | 3 km² | 117 h/km² | 41.6% | 4.3% | 22 430 €/an | 1 724 €/m² | - |
| Statistiques Cantaous | 433 | 5 km² | 87 h/km² | 35.8% | 4.2% | 22 940 €/an | 556 €/m² | - |
| Statistiques Castelbajac | 137 | 8 km² | 17 h/km² | 43.8% | 5.1% | 21 310 €/an | 1 125 €/m² | - |