Rue et porte Saint Côme
Auteur : EB
Signaler

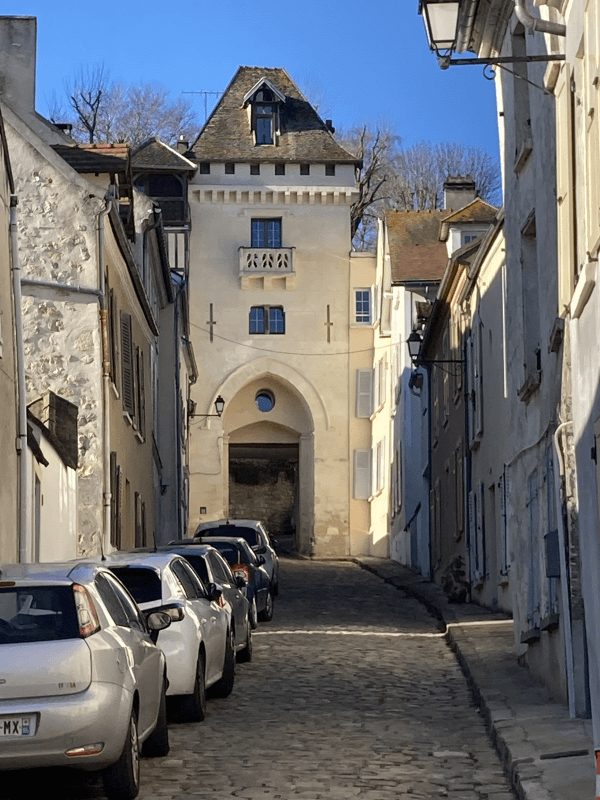
Rue et porte Saint Côme
Auteur : EB
Signaler
Quel est le profil de la population, sa situation démographique ?
| Nombre d'habitants | 4 909 | Classement |
| Age moyen | 40 ans | Classement |
| Pop active | 48.9% | Classement |
| Taux chômage | 6.6% | Classement |
| Pop densité | 245 h/km² | Classement |
| Revenu moyen | 28 090 €/an | Classement |
Quels sont les résultats des dernières élections aux présidentiels 2022 ?
 Emmanuel MACRON
 Marine LE PEN
 Jean-Luc MÉLENCHON
 Éric ZEMMOUR
 Valérie PÉCRESSE
 Yannick JADOT
 Nicolas DUPONT-AIGNAN
 Jean LASSALLE
 Fabien ROUSSEL
 Anne HIDALGO
 Philippe POUTOU
 Nathalie ARTHAUDEmmanuel MACRONMarine LE PEN
| Agressions physiques / sexuelles | 51 |
| Cambriolages | 20 |
| Vols / dégradations | 75 |
| Stupéfiants | 30 |
Commerce |
|
|---|---|
|
Hypermarché (9km) La Chapelle-en-Serval |
|
| Supermarché | 1 |
| Boulangerie | 2 |
| Boucherie | 1 |
| Station-service | 1 |
| Banque | 3 |
| La poste | 1 |
| Coiffeur | 9 |
| Vétérinaire | 3 |
| Restaurant | 13 |
Santé |
|
|---|---|
| Médecin | 8 |
| Dentiste | 1 |
| Pharmacie | 2 |
Éducation |
|
|---|---|
| Maternelle | 1 |
| Primaire | 1 |
| Collège | 1 |
| Lycée | 1 |

Carte de la ville de Luzarches

Achat / Vente / Location Votre agence immobilière à Luzarches

Les actes d'incivilités envahissent nos rues, agissons ! Un follow instagram = Un soutien
NOUVEAU : Décharges sauvages, détritus, objets abandonnés, graffitis, nids-de-poule : Déclarer un incident à Luzarches


| Ville | Habitants | Superficie | Pop densité | Pop active | Taux chômage | Revenu moyen | Prix immobilier | Note globale |
|---|---|---|---|---|---|---|---|---|
| Statistiques Chaumontel | 3 340 | 4 km² | 835 h/km² | 49.4% | 3.9% | 28 940 €/an | 3 019 €/m² | 3.5 |
| Statistiques Seugy | 1 039 | 1 km² | 1 039 h/km² | 51% | 5.6% | 28 690 €/an | 3 096 €/m² | 3.8 |
| Statistiques Lassy | 194 | 1 km² | 194 h/km² | 54.6% | 6.2% | 24 820 €/an | 2 687 €/m² | - |
| Statistiques Le Plessis-Luzarches | 140 | 0 km² | 140 h/km² | 40% | 3.6% | 28 460 €/an | 3 646 €/m² | - |
| Statistiques Épinay-Champlâtreux | 58 | 3 km² | 19 h/km² | 48.3% | 6.9% | NC | 2 917 €/m² | - |
| Statistiques Lamorlaye | 9 097 | 15 km² | 606 h/km² | 45.4% | 3.5% | 33 380 €/an | 3 400 €/m² | 3.9 |
| Statistiques Viarmes | 5 509 | 8 km² | 689 h/km² | 48.5% | 3.8% | 27 920 €/an | 3 000 €/m² | 3.9 |
| Statistiques Bellefontaine | 471 | 7 km² | 67 h/km² | 42.3% | 2.3% | 26 970 €/an | 2 882 €/m² | - |
| Statistiques Jagny-sous-Bois | 272 | 4 km² | 68 h/km² | 50.4% | 5.1% | 30 470 €/an | 2 697 €/m² | - |
| Statistiques Belloy-en-France | 2 239 | 9 km² | 249 h/km² | 53.1% | 4.3% | 27 690 €/an | 3 123 €/m² | 2.0 |
| Statistiques Asnières-sur-Oise | 3 128 | 14 km² | 223 h/km² | 50.4% | 3.3% | 28 210 €/an | 2 686 €/m² | - |
| Statistiques Coye-la-Forêt | 3 868 | 7 km² | 553 h/km² | 52.8% | 5% | 32 080 €/an | 3 335 €/m² | 5.0 |
| Statistiques Fosses | 10 249 | 3 km² | 3 416 h/km² | 47.9% | 5.1% | 23 310 €/an | 2 722 €/m² | 4.0 |
| Statistiques Saint-Martin-du-Tertre | 2 662 | 13 km² | 205 h/km² | 48% | 3.7% | 25 890 €/an | 2 831 €/m² | 4.0 |
| Statistiques Villaines-sous-Bois | 776 | 1 km² | 776 h/km² | 53.6% | 4.5% | 29 830 €/an | 3 258 €/m² | 4.6 |