


Articles en relation
Acteur de l'économie locale :Faites découvrir vos services à Marlhes
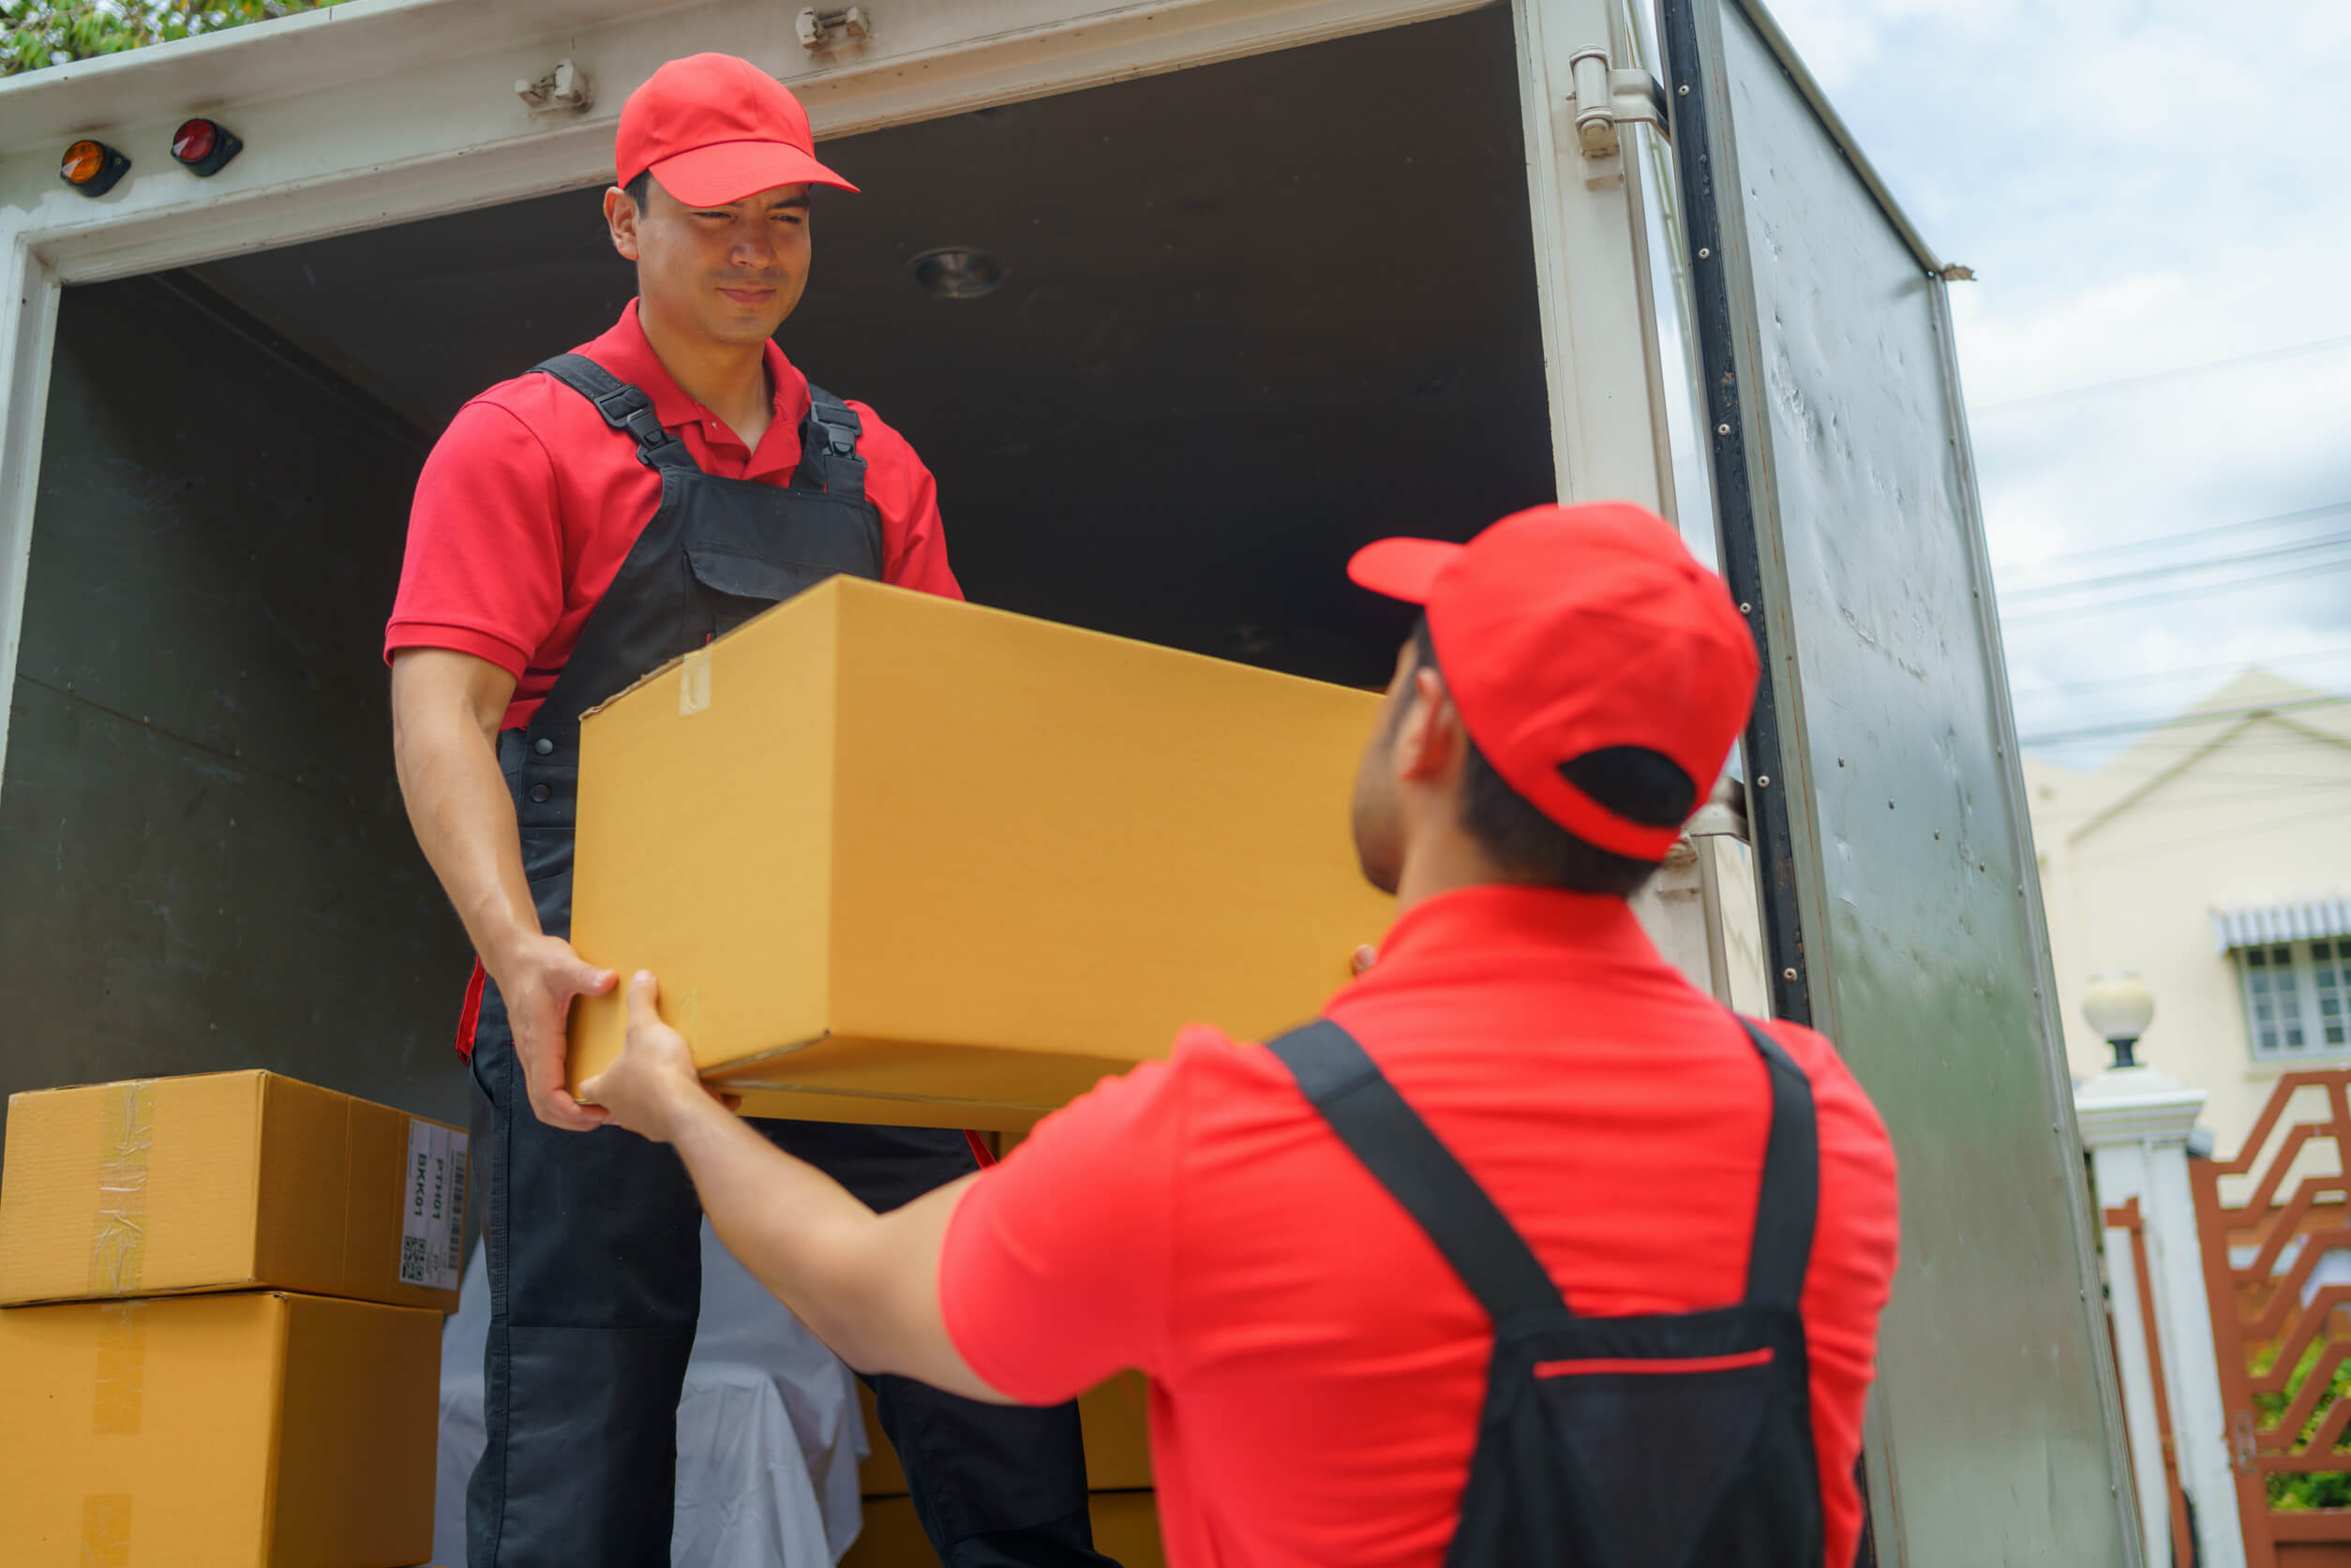
Location de monte-meubles en région PACA : un indispensable pour un déménagement sans encombre

Préserver son intimité en ville grâce aux panneaux de clôture
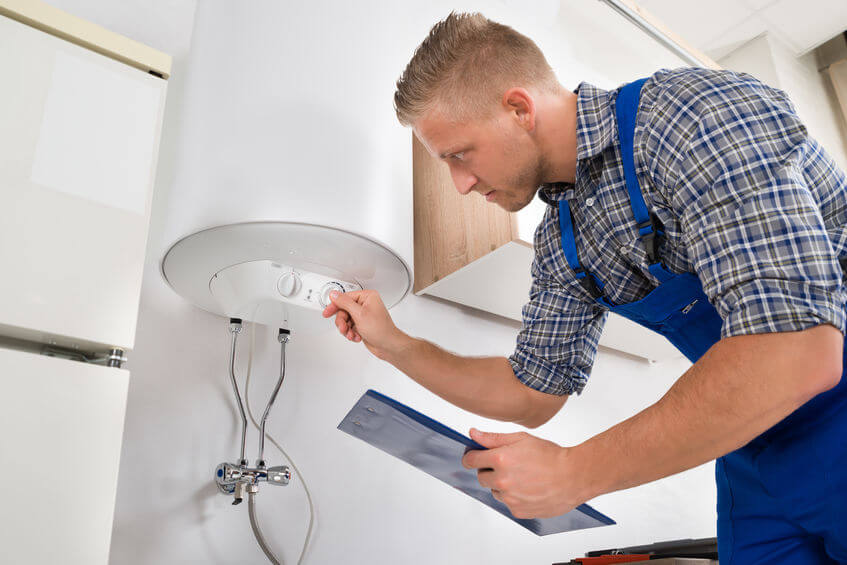
Comment choisir un technicien local pour réparer son chauffe-eau ?