Hôtel de ville
Auteur : Chabe01
Signaler

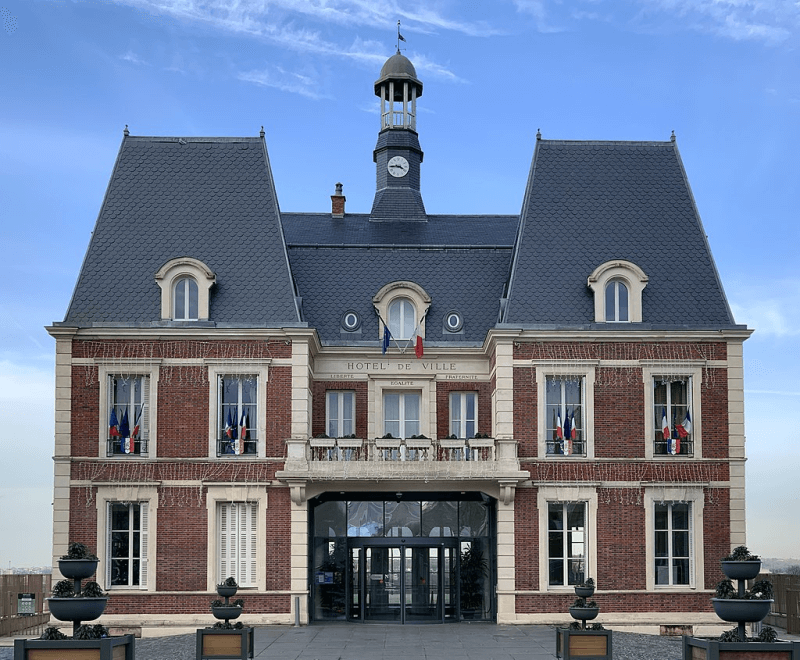
Hôtel de ville
Auteur : Chabe01
Signaler
Quel est le profil de la population, sa situation démographique ?
| Nombre d'habitants | 71 632 | Classement |
| Age moyen | 37 ans | Classement |
| Pop active | 49.6% | Classement |
| Taux chômage | 9.8% | Classement |
| Pop densité | 5 510 h/km² | Classement |
| Revenu moyen | 23 490 €/an | Classement |
Quels sont les résultats des dernières élections aux présidentiels 2022 ?
 Jean-Luc MÉLENCHON
 Emmanuel MACRON
 Marine LE PEN
 Éric ZEMMOUR
 Yannick JADOT
 Valérie PÉCRESSE
 Fabien ROUSSEL
 Nicolas DUPONT-AIGNAN
 Jean LASSALLE
 Anne HIDALGO
 Philippe POUTOU
 Nathalie ARTHAUDEmmanuel MACRONMarine LE PEN
| Agressions physiques / sexuelles | 1 016 |
| Cambriolages | 198 |
| Vols / dégradations | 2 181 |
| Stupéfiants | 856 |
| Quartier | Habitants | Superficie | Pop densité | Pop active | Taux chômage | Revenu moyen | Note globale |
|---|---|---|---|---|---|---|---|
Centre Ville |
21 005 | 3.29 km² | 6 384 h/km² | 54.3% | 5.2% | 27 934 €/an | 4.1 |
Champy |
13 323 | 1.06 km² | 12 569 h/km² | 46.3% | 7.5% | 15 565 €/an | 3.2 |
Les Coteaux |
12 186 | 1.9 km² | 6 414 h/km² | 50.8% | 5.1% | 24 885 €/an | 3.9 |
Pave Neuf |
10 975 | 1.22 km² | 8 996 h/km² | 45.7% | 10.7% | 13 394 €/an | 3.2 |
Richardets |
11 442 | 5.66 km² | 2 022 h/km² | 51% | 5.5% | 19 798 €/an | 4.2 |
Commerce |
|
|---|---|
| Hypermarché | 1 |
| Supermarché | 9 |
| Boulangerie | 21 |
| Boucherie | 14 |
| Station-service | 7 |
| Banque | 28 |
| La poste | 4 |
| Coiffeur | 52 |
| Vétérinaire | 7 |
| Restaurant | 158 |
Santé |
|
|---|---|
| Médecin | 88 |
| Dentiste | 39 |
| Pharmacie | 16 |
Éducation |
|
|---|---|
| Maternelle | 24 |
| Primaire | 24 |
| Collège | 7 |
| Lycée | 6 |
Carte de la ville de Noisy-le-Grand

Achat / Vente / Location Votre agence immobilière à Noisy-le-Grand

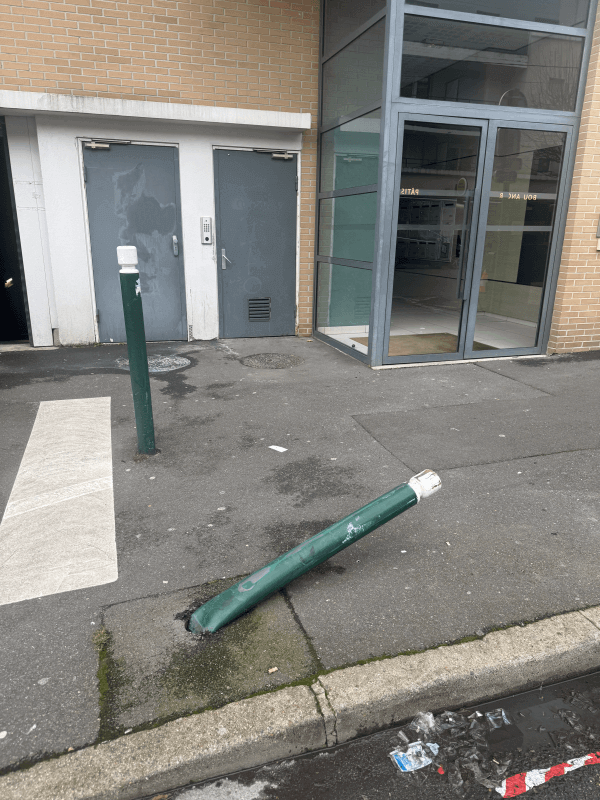
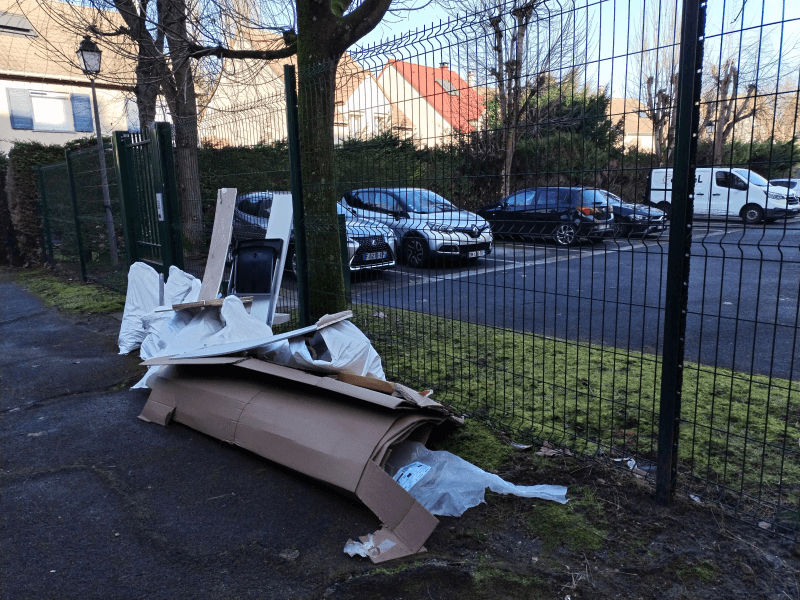
Les actes d'incivilités envahissent nos rues, agissons ! Un follow instagram = Un soutien
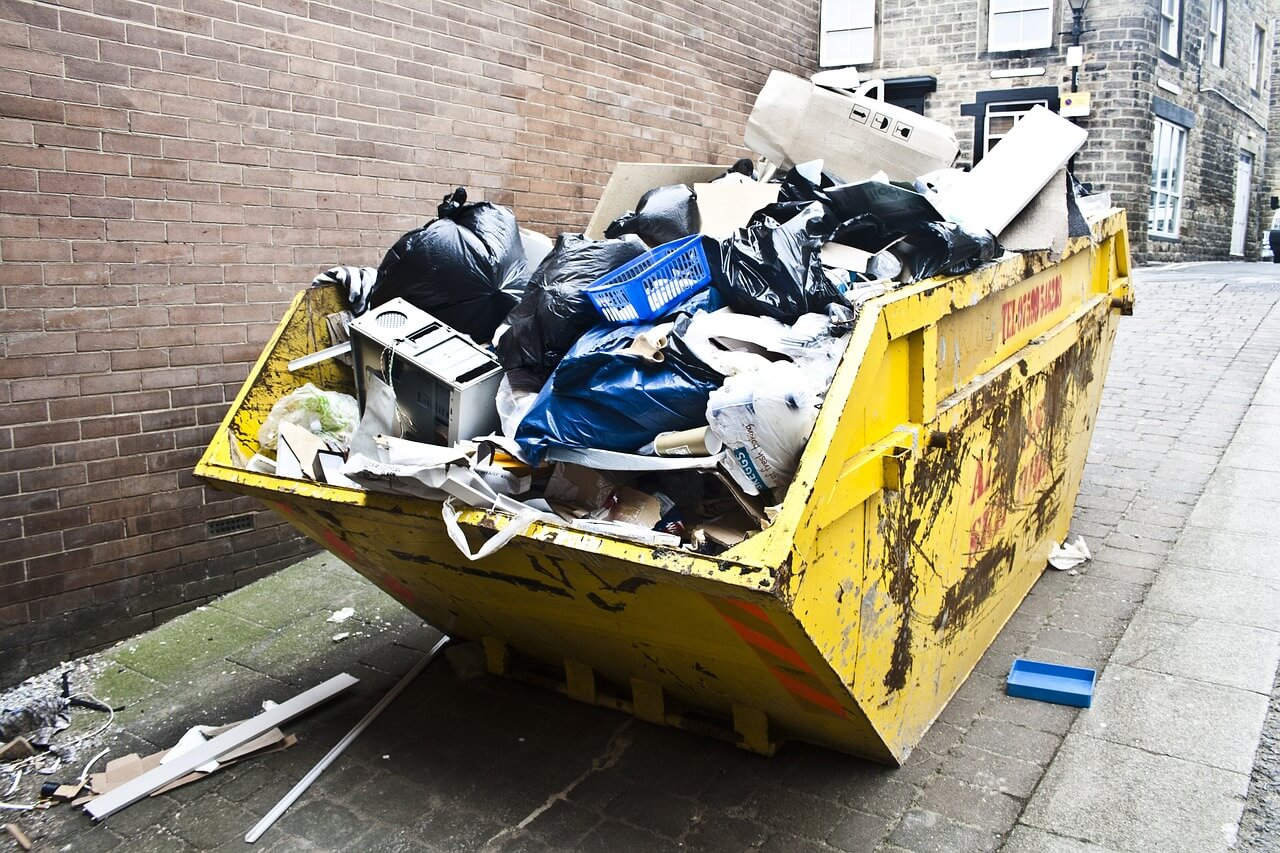
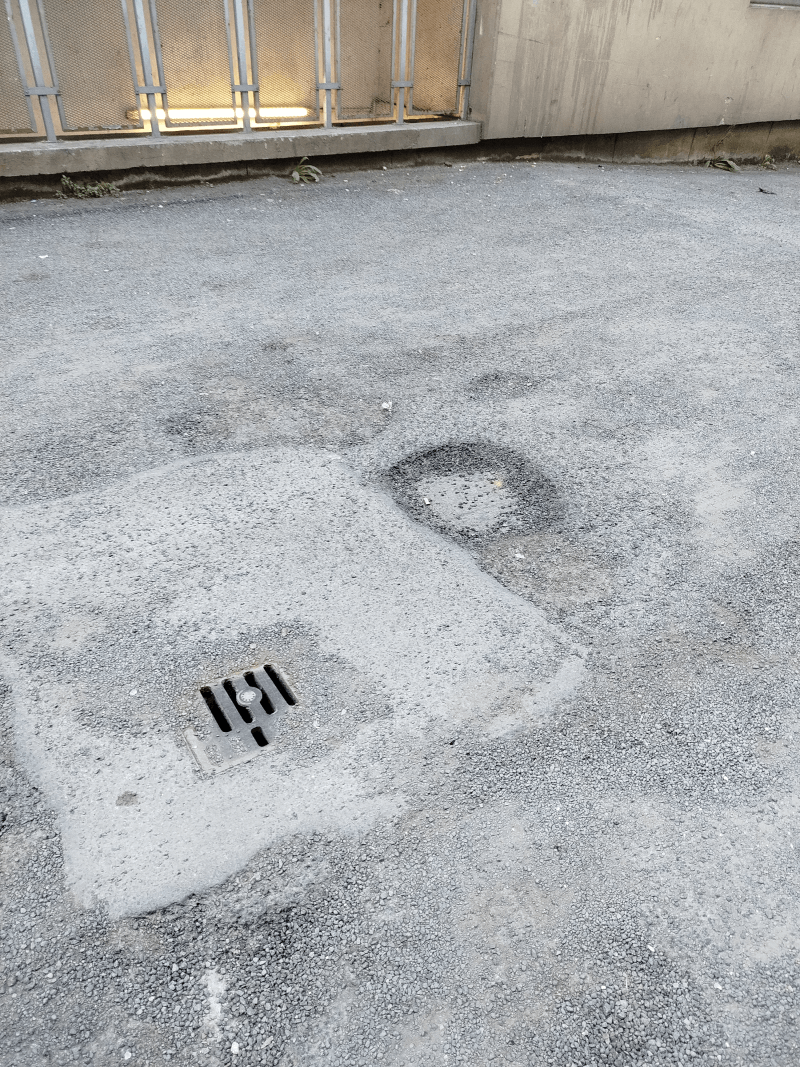
NOUVEAU : Décharges sauvages, détritus, objets abandonnés, graffitis, nids-de-poule : Déclarer un incident à Noisy-le-Grand
| Ville | Habitants | Superficie | Pop densité | Pop active | Taux chômage | Revenu moyen | Prix immobilier | Note globale |
|---|---|---|---|---|---|---|---|---|
| Statistiques Gournay-sur-Marne | 7 101 | 1 km² | 7 101 h/km² | 48.1% | 3.5% | 29 930 €/an | 4 257 €/m² | 4.3 |
| Statistiques Villiers-sur-Marne | 32 547 | 4 km² | 8 137 h/km² | 47.6% | 4.4% | 24 020 €/an | 3 835 €/m² | 3.3 |
| Statistiques Champs-sur-Marne | 26 661 | 7 km² | 3 809 h/km² | 47% | 6% | 23 750 €/an | 3 378 €/m² | 3.2 |
| Statistiques Neuilly-sur-Marne | 38 799 | 6 km² | 6 467 h/km² | 46.2% | 5.4% | 21 000 €/an | 3 191 €/m² | 3.4 |
| Statistiques Le Plessis-Trévise | 21 096 | 4 km² | 5 274 h/km² | 46.8% | 4.7% | 26 100 €/an | 3 689 €/m² | 4.0 |
| Statistiques Neuilly-Plaisance | 21 914 | 3 km² | 7 305 h/km² | 51.3% | 5.5% | 26 590 €/an | 4 208 €/m² | 3.8 |
| Statistiques Lognes | 14 678 | 3 km² | 4 893 h/km² | 51.9% | 5.1% | 22 290 €/an | 3 150 €/m² | 3.4 |
| Statistiques Bry-sur-Marne | 18 095 | 3 km² | 6 032 h/km² | 48.2% | 4.2% | 31 250 €/an | 5 085 €/m² | 4.0 |
| Statistiques Chelles | 54 372 | 15 km² | 3 625 h/km² | 48.7% | 5.6% | 23 830 €/an | 3 255 €/m² | 3.5 |
| Statistiques Gagny | 40 790 | 6 km² | 6 798 h/km² | 47.8% | 6.1% | 23 090 €/an | 3 376 €/m² | 3.3 |
| Statistiques Noisiel | 15 927 | 4 km² | 3 982 h/km² | 46.4% | 6% | 21 110 €/an | 2 974 €/m² | 3.8 |
| Statistiques Le Perreux-sur-Marne | 34 654 | 4 km² | 8 664 h/km² | 51% | 4.3% | 31 180 €/an | 5 349 €/m² | 3.7 |
| Statistiques Émerainville | 7 536 | 5 km² | 1 507 h/km² | 51.4% | 5% | 26 240 €/an | 3 306 €/m² | 2.7 |
| Statistiques Champigny-sur-Marne | 78 367 | 11 km² | 7 124 h/km² | 47.8% | 6.3% | 21 260 €/an | 3 837 €/m² | 3.1 |
| Statistiques Montfermeil | 28 257 | 5 km² | 5 651 h/km² | 43.8% | 6.3% | 20 870 €/an | 3 191 €/m² | 3.7 |