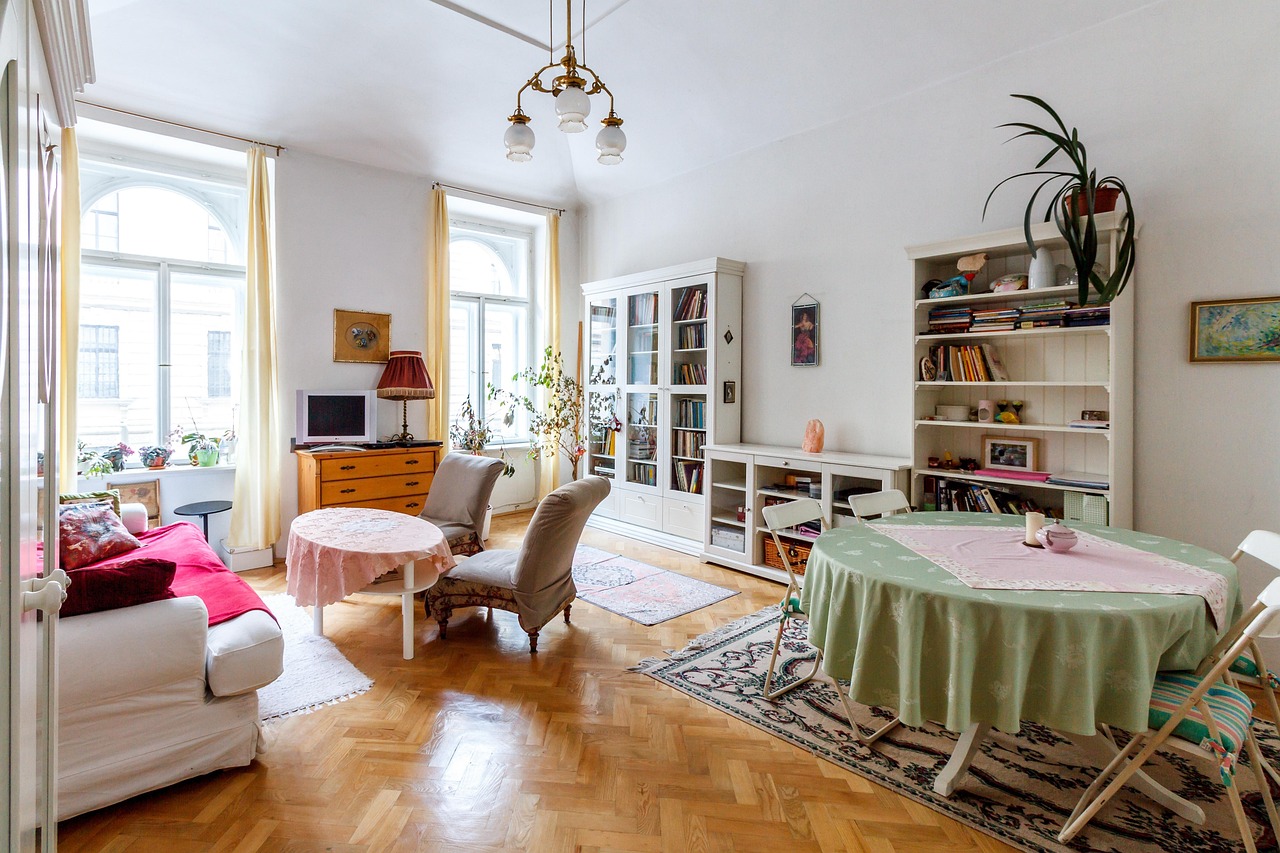
Boulevard à Sens
Auteur : ClaudineAnanda
Signaler

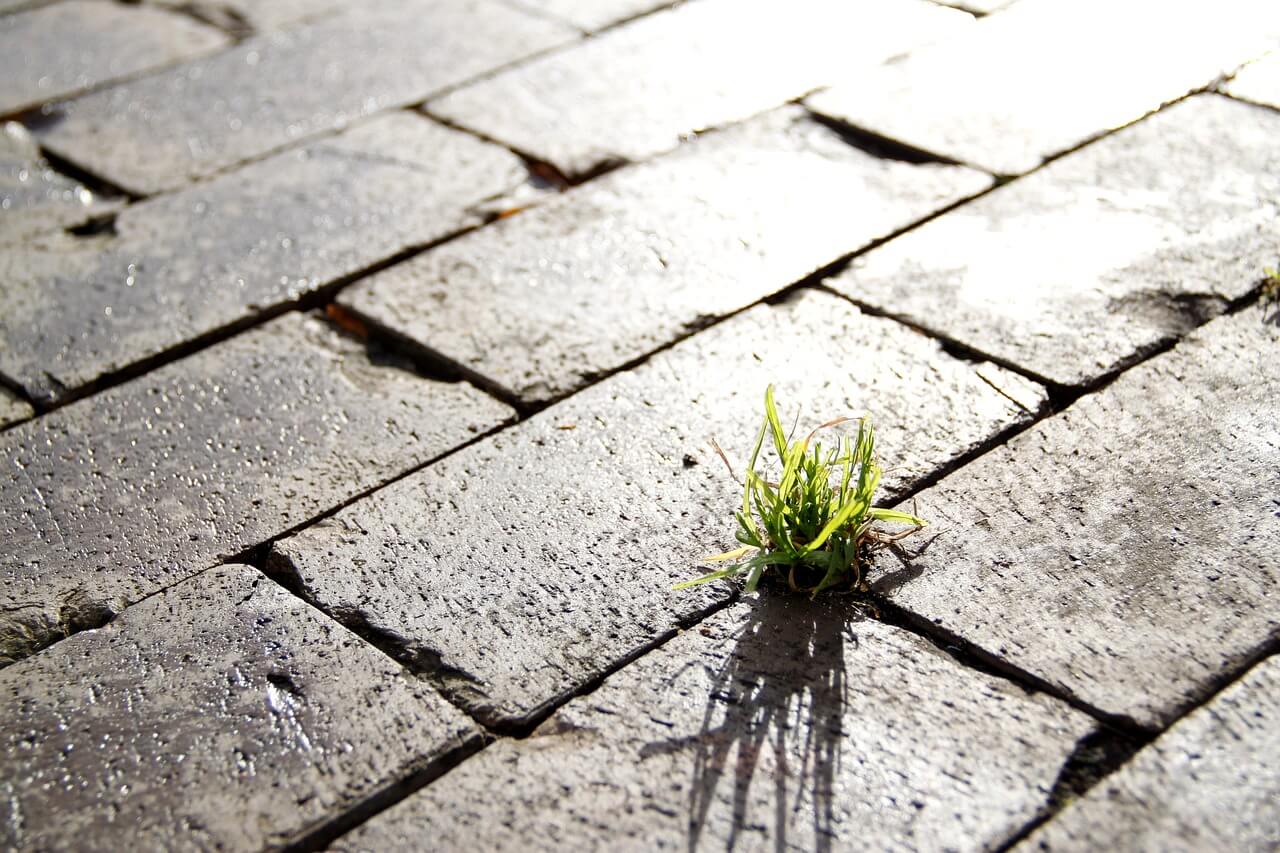
Boulevard à Sens
Auteur : ClaudineAnanda
Signaler
Quel est le profil de la population, sa situation démographique ?
| Nombre d'habitants | 27 275 | Classement |
| Age moyen | 42 ans | Classement |
| Pop active | 41.7% | Classement |
| Taux chômage | 15.6% | Classement |
| Pop densité | 1 299 h/km² | Classement |
| Revenu moyen | 18 610 €/an | Classement |
Quels sont les résultats des dernières élections aux présidentiels 2022 ?
 Jean-Luc MÉLENCHON
 Emmanuel MACRON
 Marine LE PEN
 Éric ZEMMOUR
 Valérie PÉCRESSE
 Yannick JADOT
 Nicolas DUPONT-AIGNAN
 Fabien ROUSSEL
 Jean LASSALLE
 Anne HIDALGO
 Nathalie ARTHAUD
 Philippe POUTOUEmmanuel MACRONMarine LE PEN
| Agressions physiques / sexuelles | 595 |
| Cambriolages | 122 |
| Vols / dégradations | 943 |
| Stupéfiants | 175 |
Commerce |
|
|---|---|
| Hypermarché | 3 |
| Supermarché | 6 |
| Boulangerie | 22 |
| Boucherie | 8 |
| Station-service | 8 |
| Banque | 20 |
| La poste | 2 |
| Coiffeur | 51 |
| Vétérinaire | 6 |
| Restaurant | 112 |
Santé |
|
|---|---|
| Médecin | 264 |
| Dentiste | 29 |
| Pharmacie | 16 |
Éducation |
|
|---|---|
| Maternelle | 11 |
| Primaire | 12 |
| Collège | 4 |
| Lycée | 3 |

Carte de la ville de Sens

Achat / Vente / Location Votre agence immobilière à Sens

Les actes d'incivilités envahissent nos rues, agissons ! Un follow instagram = Un soutien
NOUVEAU : Décharges sauvages, détritus, objets abandonnés, graffitis, nids-de-poule : Déclarer un incident à Sens


| Ville | Habitants | Superficie | Pop densité | Pop active | Taux chômage | Revenu moyen | Prix immobilier | Note globale |
|---|---|---|---|---|---|---|---|---|
| Statistiques Maillot | 1 271 | 6 km² | 212 h/km² | 41.6% | 4.1% | 23 040 €/an | 1 288 €/m² | - |
| Statistiques Saint-Clément | 2 813 | 8 km² | 352 h/km² | 39.7% | 3.7% | 22 290 €/an | 1 602 €/m² | - |
| Statistiques Paron | 4 855 | 10 km² | 486 h/km² | 42.9% | 7% | 21 060 €/an | 1 536 €/m² | 3.2 |
| Statistiques Saint-Martin-du-Tertre | 1 553 | 6 km² | 259 h/km² | 41.9% | 4.5% | 23 120 €/an | 1 432 €/m² | 4.6 |
| Statistiques Courtois-sur-Yonne | 783 | 4 km² | 196 h/km² | 40% | 4.1% | 24 680 €/an | 1 541 €/m² | 2.8 |
| Statistiques Saint-Denis-lès-Sens | 624 | 6 km² | 104 h/km² | 40.4% | 4.2% | 22 280 €/an | 1 629 €/m² | 2.6 |
| Statistiques Malay-le-Grand | 1 635 | 21 km² | 78 h/km² | 41.2% | 3.6% | 24 140 €/an | 1 307 €/m² | - |
| Statistiques Nailly | 1 329 | 21 km² | 63 h/km² | 47.4% | 3% | 23 730 €/an | 1 220 €/m² | - |
| Statistiques Saligny | 658 | 10 km² | 66 h/km² | 45% | 3% | 26 160 €/an | 1 765 €/m² | - |
| Statistiques Gron | 1 260 | 11 km² | 115 h/km² | 50.9% | 5% | 24 240 €/an | 1 562 €/m² | 4.4 |
| Statistiques Rosoy | 1 077 | 6 km² | 180 h/km² | 51.2% | 4% | 25 760 €/an | 1 301 €/m² | - |
| Statistiques Cuy | 863 | 7 km² | 123 h/km² | 46.7% | 4.3% | 23 020 €/an | 1 316 €/m² | - |
| Statistiques Soucy | 1 546 | 21 km² | 74 h/km² | 46% | 3.3% | 23 690 €/an | 1 383 €/m² | 3.6 |
| Statistiques Collemiers | 661 | 10 km² | 66 h/km² | 48.3% | 2% | 25 380 €/an | 1 428 €/m² | - |
| Statistiques Villenavotte | 162 | 2 km² | 81 h/km² | 38.3% | 3.1% | 23 850 €/an | 1 719 €/m² | - |