Thivel
Auteur : Ce
Signaler

Thivel
Auteur : Ce
Signaler
Quel est le profil de la population, sa situation démographique ?
| Nombre d'habitants | 10 881 | Classement |
| Age moyen | 42 ans | Classement |
| Pop active | 41.5% | Classement |
| Taux chômage | 11.9% | Classement |
| Pop densité | 777 h/km² | Classement |
| Revenu moyen | 19 730 €/an | Classement |
Quels sont les résultats des dernières élections aux présidentiels 2022 ?
 Emmanuel MACRON
 Marine LE PEN
 Jean-Luc MÉLENCHON
 Éric ZEMMOUR
 Valérie PÉCRESSE
 Yannick JADOT
 Jean LASSALLE
 Nicolas DUPONT-AIGNAN
 Anne HIDALGO
 Fabien ROUSSEL
 Philippe POUTOU
 Nathalie ARTHAUDEmmanuel MACRONMarine LE PEN
| Agressions physiques / sexuelles | 152 |
| Cambriolages | 32 |
| Vols / dégradations | 251 |
| Stupéfiants | 32 |
Commerce |
|
|---|---|
|
Hypermarché (16km) L'Arbresle |
|
| Supermarché | 3 |
| Boulangerie | 6 |
| Boucherie | 7 |
| Station-service | 2 |
| Banque | 11 |
| La poste | 1 |
| Coiffeur | 17 |
| Vétérinaire | 3 |
| Restaurant | 41 |
Santé |
|
|---|---|
| Médecin | 84 |
| Dentiste | 18 |
| Pharmacie | 6 |
Éducation |
|
|---|---|
| Maternelle | 5 |
| Primaire | 5 |
| Collège | 2 |
| Lycée | 3 |
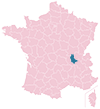
Carte de la ville de Tarare

Achat / Vente / Location Votre agence immobilière à Tarare

Les actes d'incivilités envahissent nos rues, agissons ! Un follow instagram = Un soutien
NOUVEAU : Décharges sauvages, détritus, objets abandonnés, graffitis, nids-de-poule : Déclarer un incident à Tarare


| Ville | Habitants | Superficie | Pop densité | Pop active | Taux chômage | Revenu moyen | Prix immobilier | Note globale |
|---|---|---|---|---|---|---|---|---|
| Statistiques Saint-Marcel-l'Éclairé | 568 | 11 km² | 52 h/km² | 46.1% | 1.8% | 24 570 €/an | 1 383 €/m² | - |
| Statistiques Saint-Clément-sur-Valsonne | 904 | 14 km² | 65 h/km² | 48% | 3.4% | 23 400 €/an | 1 758 €/m² | - |
| Statistiques Joux | 753 | 25 km² | 30 h/km² | 53.4% | 5.6% | 23 230 €/an | 1 790 €/m² | 3.1 |
| Statistiques Vindry-sur-Turdine | 5 283 | 23 km² | 230 h/km² | 48.5% | 2.9% | 25 190 €/an | 2 410 €/m² | - |
| Statistiques Les Sauvages | 621 | 12 km² | 52 h/km² | 53.3% | 3.5% | 23 270 €/an | 2 451 €/m² | - |
| Statistiques Valsonne | 994 | 18 km² | 55 h/km² | 51% | 2.9% | 22 710 €/an | 1 711 €/m² | - |
| Statistiques Saint-Forgeux | 1 538 | 22 km² | 70 h/km² | 48% | 1.8% | 24 220 €/an | 1 555 €/m² | 4.2 |
| Statistiques Dième | 196 | 9 km² | 22 h/km² | 46.4% | 3.1% | 23 960 €/an | 1 697 €/m² | - |
| Statistiques Affoux | 397 | 10 km² | 40 h/km² | 54.2% | 3.5% | 24 970 €/an | 1 453 €/m² | 3.2 |
| Statistiques Saint-Vérand | 1 147 | 17 km² | 67 h/km² | 52.3% | 1.7% | 25 940 €/an | 2 348 €/m² | - |
| Statistiques Sarcey | 979 | 10 km² | 98 h/km² | 54.2% | 3.1% | 27 830 €/an | 2 615 €/m² | 3.8 |
| Statistiques Violay | 1 210 | 27 km² | 45 h/km² | 44.6% | 3.1% | 22 060 €/an | 1 598 €/m² | 2.0 |
| Statistiques Machézal | 401 | 13 km² | 31 h/km² | 48.9% | 3.2% | 21 010 €/an | 1 053 €/m² | 4.0 |
| Statistiques Saint-Appolinaire | 235 | 5 km² | 47 h/km² | 47.2% | 2.1% | 23 190 €/an | 1 548 €/m² | - |
| Statistiques Villechenève | 908 | 14 km² | 65 h/km² | 50.1% | 2.1% | 22 900 €/an | 1 692 €/m² | - |