Villars, square de la mairie
Auteur : Rose
Signaler

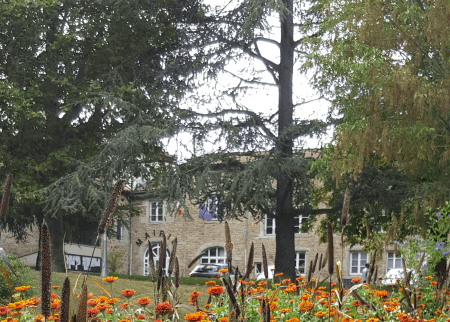
Villars, square de la mairie
Auteur : Rose
Signaler
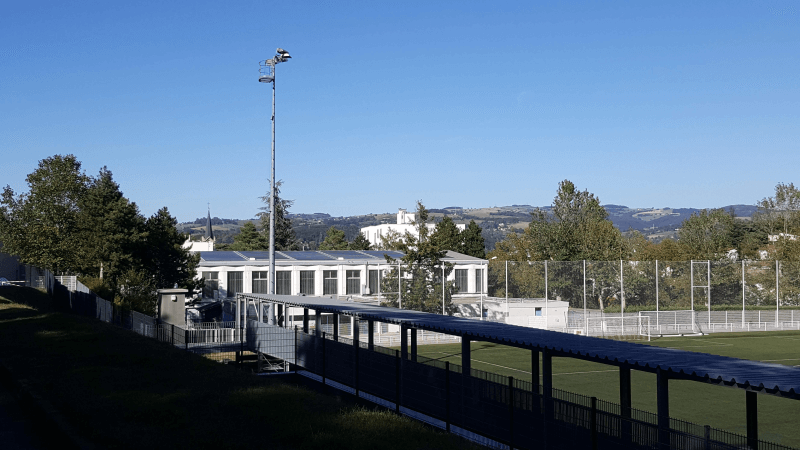
Promenade le long des espaces sportifs
Auteur : Rose
Signaler
Quel est le profil de la population, sa situation démographique ?
| Nombre d'habitants | 7 705 | Classement |
| Age moyen | 43 ans | Classement |
| Pop active | 44.8% | Classement |
| Taux chômage | 6.3% | Classement |
| Pop densité | 1 541 h/km² | Classement |
| Revenu moyen | 23 540 €/an | Classement |
Quels sont les résultats des dernières élections aux présidentiels 2022 ?
 Emmanuel MACRON
 Marine LE PEN
 Jean-Luc MÉLENCHON
 Éric ZEMMOUR
 Yannick JADOT
 Valérie PÉCRESSE
 Fabien ROUSSEL
 Nicolas DUPONT-AIGNAN
 Jean LASSALLE
 Anne HIDALGO
 Philippe POUTOU
 Nathalie ARTHAUDEmmanuel MACRONMarine LE PEN
| Agressions physiques / sexuelles | 35 |
| Cambriolages | 44 |
| Vols / dégradations | 173 |
| Stupéfiants | 14 |
Commerce |
|
|---|---|
| Hypermarché | 1 |
|
Supermarché (1km) Saint-Priest-en-Jarez |
|
| Boulangerie | 5 |
| Boucherie | 1 |
| Station-service | 1 |
| Banque | 2 |
| La poste | 1 |
| Coiffeur | 12 |
| Vétérinaire | 1 |
| Restaurant | 16 |
Santé |
|
|---|---|
| Médecin | 9 |
| Dentiste | 5 |
| Pharmacie | 3 |
Éducation |
|
|---|---|
| Maternelle | 4 |
| Primaire | 3 |
|
Collège (5km) Roche-la-Molière |
|
| Lycée | 1 |
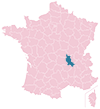
Carte de la ville de Villars

Achat / Vente / Location Votre agence immobilière à Villars

Les actes d'incivilités envahissent nos rues, agissons ! Un follow instagram = Un soutien
NOUVEAU : Décharges sauvages, détritus, objets abandonnés, graffitis, nids-de-poule : Déclarer un incident à Villars


| Ville | Habitants | Superficie | Pop densité | Pop active | Taux chômage | Revenu moyen | Prix immobilier | Note globale |
|---|---|---|---|---|---|---|---|---|
| Statistiques Saint-Priest-en-Jarez | 6 318 | 3 km² | 2 106 h/km² | 44% | 4.2% | 25 120 €/an | 2 100 €/m² | 3.2 |
| Statistiques Saint-Genest-Lerpt | 6 182 | 12 km² | 515 h/km² | 44.2% | 3.5% | 24 970 €/an | 2 042 €/m² | 3.7 |
| Statistiques L'Étrat | 2 820 | 8 km² | 353 h/km² | 45% | 3.5% | 27 460 €/an | 2 505 €/m² | 2.5 |
| Statistiques La Tour-en-Jarez | 1 484 | 5 km² | 297 h/km² | 43.4% | 2.2% | 30 650 €/an | 2 052 €/m² | 3.5 |
| Statistiques La Fouillouse | 4 643 | 20 km² | 232 h/km² | 46% | 2.6% | 26 800 €/an | 1 953 €/m² | 3.2 |
| Statistiques Roche-la-Molière | 9 853 | 17 km² | 580 h/km² | 44.5% | 4.6% | 22 590 €/an | 1 761 €/m² | 3.8 |
| Statistiques Saint-Étienne | 172 569 | 80 km² | 2 157 h/km² | 42.3% | 8.3% | 19 010 €/an | 1 135 €/m² | 3.2 |
| Statistiques Saint-Héand | 3 684 | 31 km² | 119 h/km² | 45% | 2.4% | 25 650 €/an | 2 073 €/m² | 4.2 |
| Statistiques La Talaudière | 7 103 | 7 km² | 1 015 h/km² | 39.3% | 3.1% | 23 700 €/an | 2 269 €/m² | 3.6 |
| Statistiques La Ricamarie | 8 162 | 7 km² | 1 166 h/km² | 34.3% | 7.4% | 17 020 €/an | 1 087 €/m² | 2.6 |
| Statistiques Le Chambon-Feugerolles | 12 307 | 17 km² | 724 h/km² | 38.2% | 6.5% | 18 610 €/an | 1 499 €/m² | 2.3 |
| Statistiques Sorbiers | 8 071 | 12 km² | 673 h/km² | 45.4% | 3.4% | 25 720 €/an | 2 415 €/m² | 3.8 |
| Statistiques Saint-Jean-Bonnefonds | 6 594 | 11 km² | 599 h/km² | 44.9% | 4.1% | 23 950 €/an | 2 071 €/m² | 3.2 |
| Statistiques Chambles | 1 071 | 18 km² | 60 h/km² | 48.7% | 2.3% | 27 140 €/an | 2 131 €/m² | - |
| Statistiques Saint-Just-Saint-Rambert | 15 579 | 40 km² | 389 h/km² | 45.2% | 3% | 26 190 €/an | 2 168 €/m² | 3.7 |